Troubleshooting Pinot
Find debug information in Pinot
Pinot offers various ways to assist with troubleshooting and debugging problems that might happen.
Start with the debug API which will surface many of the commonly occurring problems. The debug api provides information such as tableSize, ingestion status, and error messages related to state transition in server.
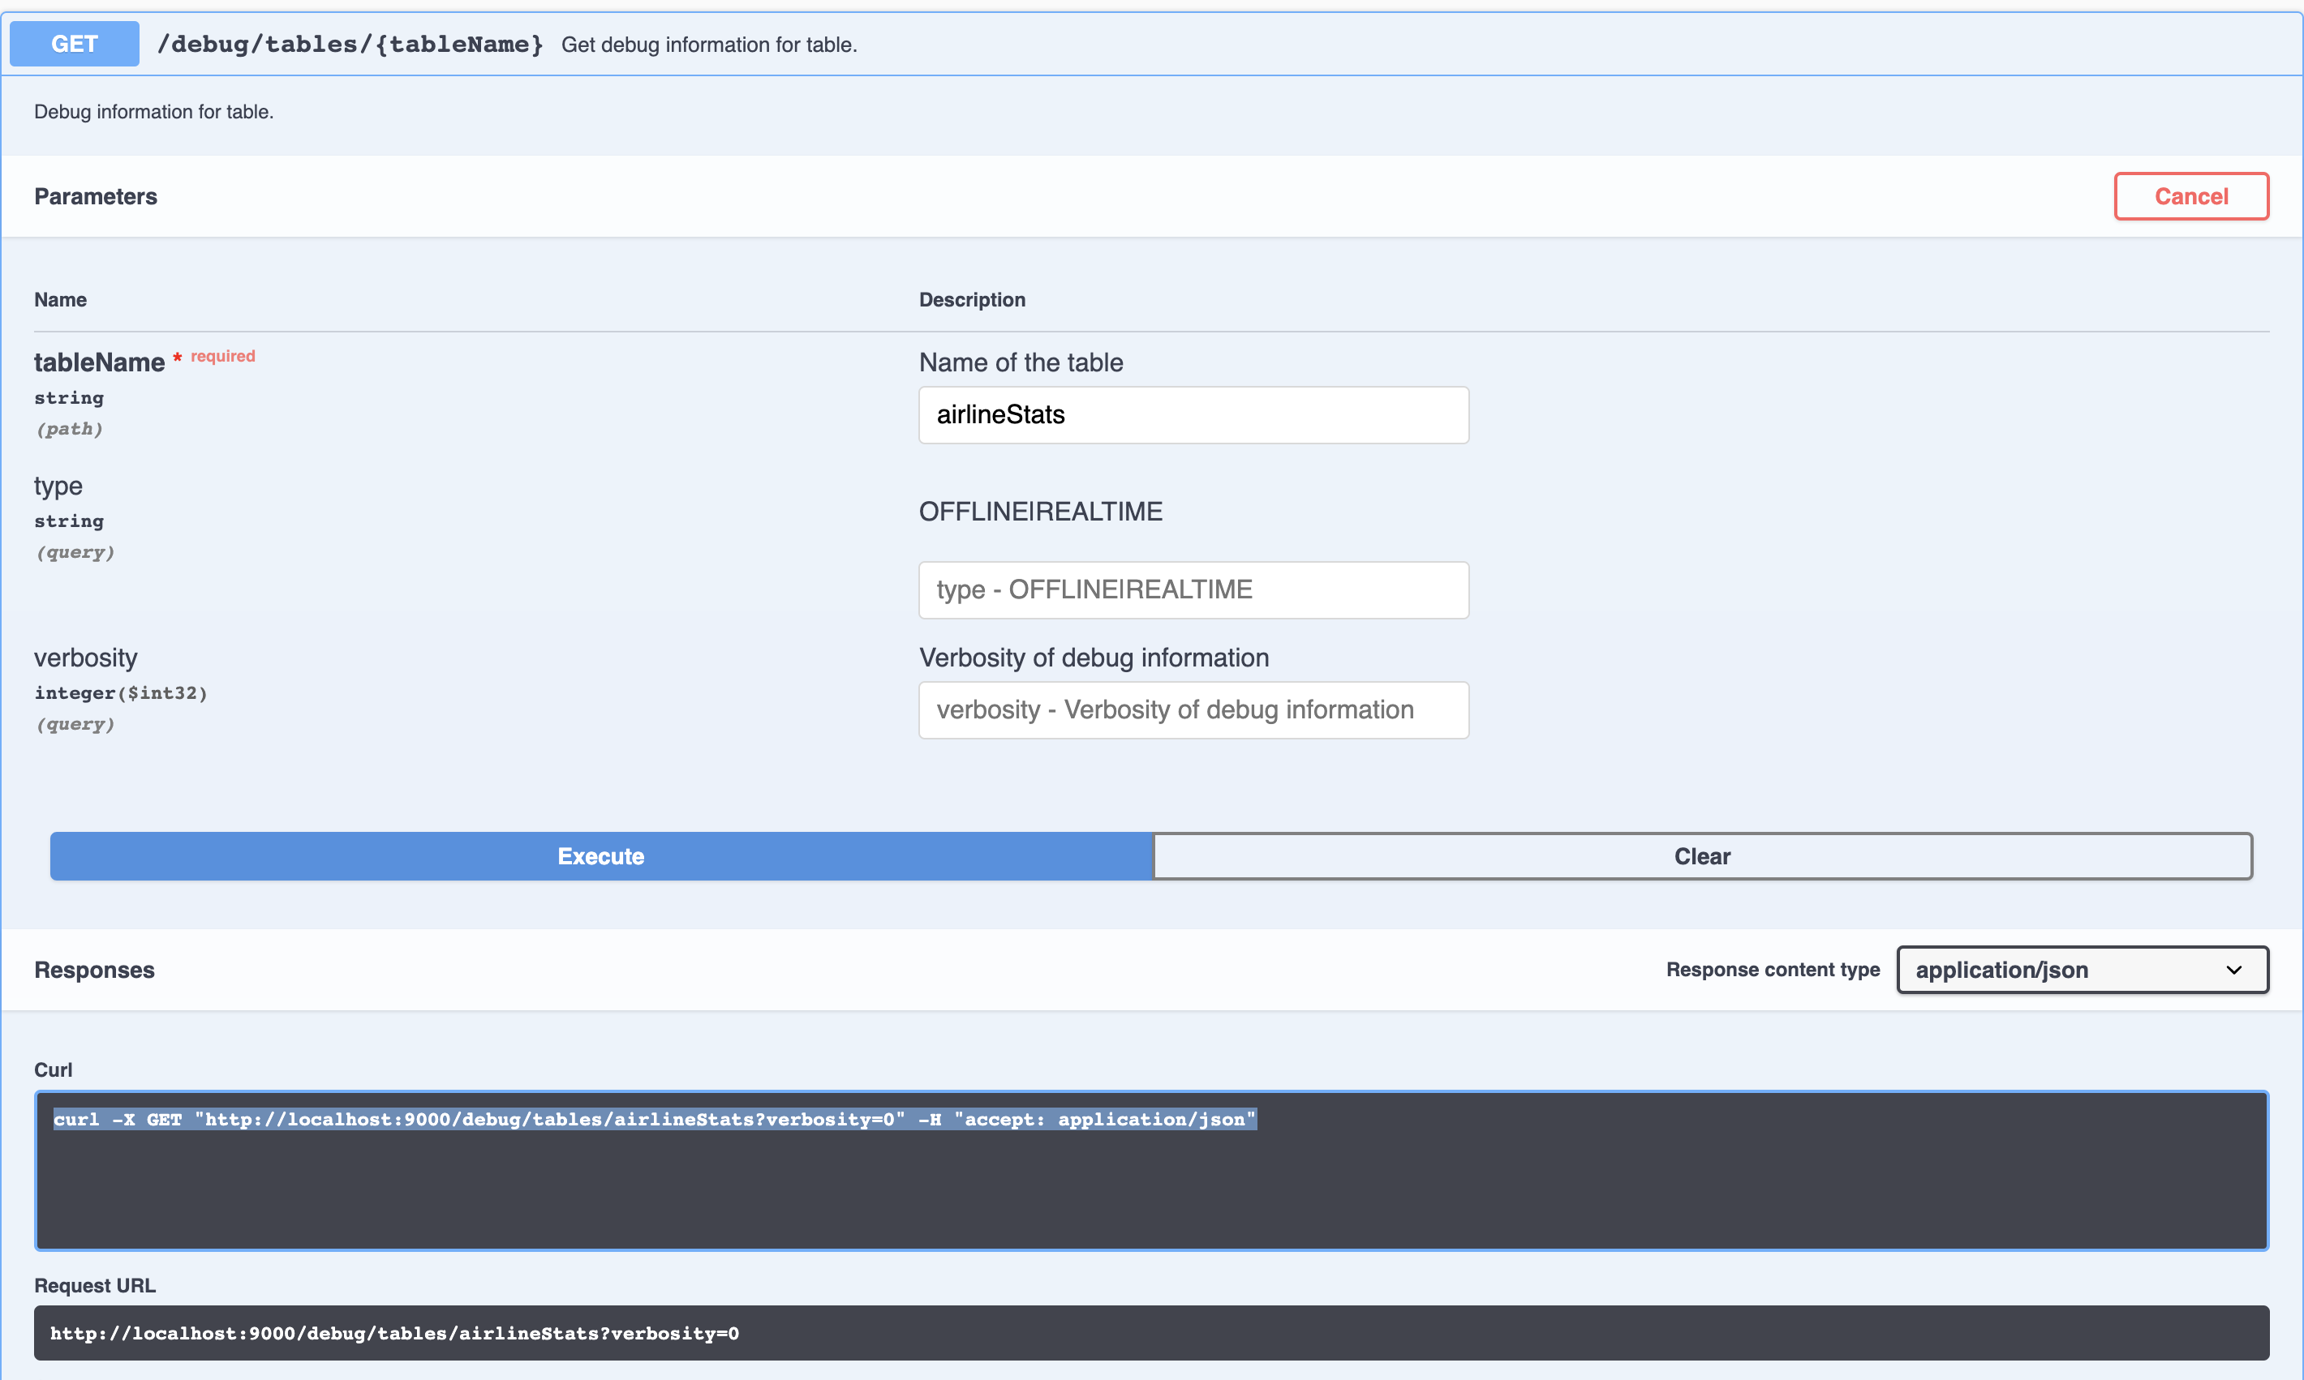
The table debug API can be invoked via the Swagger UI, as in the following image:

It can also be invoked directly by accessing the URL as follows. The api requires the tableName, and can optionally take tableType (offline|realtime) and verbosity level.
Pinot also provides a variety of operational metrics that can be used for creating dashboards, alerting and monitoring.
Finally, all pinot components log debug information related to error conditions.
Debug a slow query or a query which keeps timing out
Use the following steps:
If the query executes, look at the query result. Specifically look at
numEntriesScannedInFilterandnumDocsScanned.If
numEntriesScannedInFilteris very high, consider adding indexes for the corresponding columns being used in the filter predicates. You should also think about partitioning the incoming data based on the dimension most heavily used in your filter queries.If
numDocsScannedis very high, that means the selectivity for the query is low and lots of documents need to be processed after the filtering. Consider refining the filter to increase the selectivity of the query.
If the query is not executing, you can extend the query timeout by appending a
timeoutMsparameter to the query, for example,select * from mytable limit 10 option(timeoutMs=60000). Then repeat step 1, as needed.Look at garbage collection (GC) stats for the corresponding Pinot servers. If a particular server seems to be running full GC all the time, you can do a couple of things such as
Increase Java Virtual Machine (JVM) heap (
java -Xmx<size>).Consider using off-heap memory for segments.
Decrease the total number of segments per server (by partitioning the data in a more efficient way).
Was this helpful?

