Cluster is a set of nodes comprising of servers, brokers, controllers and minions.
Pinot cluster components
Pinot uses Apache Helix for cluster management. Helix is a cluster management framework that manages replicated, partitioned resources in a distributed system. Helix uses Zookeeper to store cluster state and metadata.
Cluster components
Helix divides nodes into logical components based on their responsibilities:
Participant
The nodes that host distributed, partitioned resources
Pinot Servers are modeled as Participants. For more details about server nodes, see Server.
Spectator
The nodes that observe the current state of each Participant and use that information to access the resources. Spectators are notified of state changes in the cluster (state of a participant, or that of a partition in a participant).
Pinot Brokers are modeled as Spectators. For more details about broker nodes, see .
The node that observes and controls the Participant nodes. It is responsible for coordinating all transitions in the cluster and ensuring that state constraints are satisfied while maintaining cluster stability.
Pinot Controllers are modeled as Controllers. For more details about controller nodes, see .
Another way to visualize the cluster is a logical view, where:
A cluster contains
Tenants contain
Tables contain .
Typically, there is only one cluster per environment/data center. There is no need to create multiple Pinot clusters since Pinot supports the concept of . At LinkedIn, the largest Pinot cluster consists of 1000+ nodes.
To set up a cluster, see one of the following guides:
Broker
Brokers handle Pinot queries. They accept queries from clients and forward them to the right servers. They collect results back from the servers and consolidate them into a single response, to send back to the client.
Broker interaction with other components
Pinot Brokers are modeled as Helix Spectators. They need to know the location of each segment of a table (and each replica of the segments) and route requests to the appropriate server that hosts the segments of the table being queried.
The broker ensures that all the rows of the table are queried exactly once so as to return correct, consistent results for a query. The brokers may optimize to prune some of the segments as long as accuracy is not sacrificed.
Helix provides the framework by which spectators can learn the location in which each partition of a resource (i.e. participant) resides. The brokers use this mechanism to learn the servers that host specific segments of a table.
In the case of hybrid tables, the brokers ensure that the overlap between real-time and offline segment data is queried exactly once, by performing offline and real-time federation.
Let's take this example, we have real-time data for 5 days - March 23 to March 27, and offline data has been pushed until Mar 25, which is 2 days behind real-time. The brokers maintain this time boundary.
Suppose, we get a query to this table : select sum(metric) from table. The broker will split the query into 2 queries based on this time boundary - one for offline and one for realtime. This query becomes - select sum(metric) from table_REALTIME where date >= Mar 25
and select sum(metric) from table_OFFLINE where date < Mar 25
The broker merges results from both these queries before returning the result to the client.
Make sure you've . If you're using docker, make sure to . To start a broker
Introduction
Apache Pinot, a real-time distributed OLAP datastore, purpose-built for low-latency high throughput analytics, perfect for user-facing analytical workloads.
Pinot is a real-time distributed OLAP datastore, purpose-built to provide ultra low-latency analytics, even at extremely high throughput. It can ingest directly from streaming data sources - such as Apache Kafka and Amazon Kinesis - and make the events available for querying instantly. It can also ingest from batch data sources such as Hadoop HDFS, Amazon S3, Azure ADLS, and Google Cloud Storage.
At the heart of the system is a columnar store, with several smart indexing and pre-aggregation techniques for low latency. This makes Pinot the most perfect fit for user-facing realtime analytics. At the same time, Pinot is also a great choice for other analytical use-cases, such as internal dashboards, anomaly detection, and ad-hoc data exploration.
Pinot was built by engineers at LinkedIn and Uber and is designed to scale up and out with no upper bound. Performance always remains constant based on the size of your cluster and an expected query per second (QPS) threshold.
User-facing analytics, or site-facing analytics, is the analytical tools and applications that you would expose directly to the end-users of your product. In a user-facing analytics application, think of the user-base as ALL end users of an App. This App could be a social networking app, or a food delivery app - anything at all. It’s not just a few analysts doing offline analysis, or a handful of data scientists in a company running ad-hoc queries. This is ALL end-users, receiving personalized analytics on their personal devices (think 100s of 1000s of queries per second). These queries are triggered by apps, and not written by people, and so the scale will be as much as the active users on that App (think millions of events/sec)
And, this is for all the freshest possible data, which touches on the other aspect here - realtime analytics. "Yesterday" might be a long time ago for some businesses and they cannot wait for ETLs and batch jobs. The data needs to be used for analytics, as soon as it is generated (think latencies < 1s).
Wanting such a user-facing analytics application, using realtime events, sounds great. But what does it mean for the underlying infrastructure, to support such an analytical workload?
Such applications require the freshest possible data, and so the system needs to be able to ingest data in real time and make it available for querying, also in real time.
Data for such apps tend to be event data, for a wide range of actions, coming from multiple sources, and so the data comes in at a very high velocity and tends to be highly dimensional.
Queries are triggered by end-users interacting with apps - with queries per second in hundreds of thousands, with arbitrary query patterns,
This video talks more about user-facing real-time analytics, and how Pinot is used to achieve that.
Here's another great video that goes into the details of how Pinot tackles some of the challenges faced in handling a user-facing analytics workload.
Pinot originated at LinkedIn which currently has one of the largest deployment powering more than 50+ user facing applications such as Viewed My Profile, Talent Analytics, Company Analytics, Ad Analytics and many more. At LinkedIn, Pinot also serves as the backend to visualize and monitor 10,000+ business metrics.
With Pinot's growing popularity, several companies are now using it in production to power a variety of analytics use cases. A detailed list of companies using Pinot can be found .
A column-oriented database with various compression schemes such as Run Length, Fixed Bit Length
Pluggable indexing technologies - Sorted Index, Bitmap Index, Inverted Index, StarTree Index, Bloom Filter, Range Index, Text Search Index(Lucence/FST), Json Index, Geospatial Index
Ability to optimize query/execution plan based on query and segment metadata
Pinot is designed to execute OLAP queries with low latency. It is suited in contexts where fast analytics, such as aggregations, are needed on immutable data, possibly, with real-time data ingestion.
User facing Analytics Products
Pinot is the perfect choice for user-facing analytics products. Pinot was originally built at LinkedIn to power rich interactive real-time analytic applications such as , , , and many more. is another example of a customer-facing Analytics App. At LinkedIn, Pinot powers 50+ user-facing products, ingesting millions of events per second and serving 100k+ queries per second at millisecond latency.
Real-time Dashboard for Business Metrics
Pinot can be also be used to perform typical analytical operations such as slice and dice, drill down, roll up, and pivot on large scale multi-dimensional data. For instance, at LinkedIn, Pinot powers dashboards for thousands of business metrics. One can connect various BI tools such as Superset, Tableau, or PowerBI to visualize data in Pinot.
Instructions to connect Pinot with Superset can be found .
Anomaly Detection
In addition to visualizing data in Pinot, one can run Machine Learning Algorithms to detect Anomalies in the data stored in Pinot. See for more information on how to use Pinot for Anomaly Detection and Root Cause Analysis.
While Pinot doesn't match the typical mold of a database product, it is best understood based on your role as either an analyst, data scientist, or application developer.
Enterprise business intelligence
For analysts and data scientists, Pinot is best viewed as a highly-scalable data platform for business intelligence. In this view, Pinot converges big data platforms with the traditional role of a data warehouse, making it a suitable replacement for analysis and reporting.
Enterprise application development
For application developers, Pinot is best viewed as an immutable aggregate store that sources events from streaming data sources, such as Kafka, and makes it available for a query using SQL.
As is the case with a microservice architecture, data encapsulation ends up requiring each application to provide its own data store, as opposed to sharing one OLTP database for reads and writes. In this case, it becomes difficult to query the complete view of a domain because it becomes stored in many different databases. This is costly in terms of performance since it requires joins across multiple microservices that expose their data over HTTP under a REST API. To prevent this, Pinot can be used to aggregate all of the data across a microservice architecture into one easily queryable view of the domain.
Pinot prevent any possibility of sharing ownership of database tables across microservice teams. Developers can create their own query models of data from multiple systems of record depending on their use case and needs. As with all aggregate stores, query models are eventually consistent and immutable.
Our documentation is structured to let you quickly get to the content you need and is organized around the different concerns of users, operators, and developers. If you're new to Pinot and want to learn things by example, please take a look at our getting started section.
To start importing data into Pinot, check out our guides on batch import and stream ingestion based on our .
Pinot works very well for querying time series data with many dimensions and metrics over a vast unbounded space of records that scales linearly on a per-node basis. Filters and aggregations are both easy and fast.
Pinot supports SQL for querying read-only data. Learn more about querying Pinot for time series data in our guide.
Pinot may be deployed to and operated on a cloud provider or a local or virtual machine. You may get started either with a bare-metal installation or a Kubernetes one (either locally or in the cloud). To get immediately started with Pinot, check out these quick start guides for bootstrapping a Pinot cluster using Docker or Kubernetes.
For a high-level overview that explains how Pinot works, please take a look at our basic concepts section.
To understand the distributed systems architecture that explains Pinot's operating model, please take a look at our basic architecture section.
Deep Store
Learn about the deep store that stores a compressed copy of segment files in Pinot.
The deep store (or deep storage) is the permanent store for segment files.
It is used for backup and restore operations. New server nodes in a cluster will pull down a copy of segment files from the deep store. If the local segment files on a server gets damaged in some way (or accidentally deleted), a new copy will be pulled down from the deep store on server restart.
The deep store stores a compressed version of the segment files and it typically won't include any indexes. These compressed files can be stored on a local file system or on a variety of other file systems. For more details on supported file systems, see File Systems.
Note: Deep Store by itself is not sufficient for restore operations. Pinot stores metadata such as table config, schema, segment metadata in Zookeeper. For restore operations, both Deep Store as well as Zookeeper metadata are required.
How do segments get into the Deep Store?
There are several different ways that segments are persisted in the deep store.
For offline tables, the batch ingestion job writes the segment directly into the deep store, as shown in the diagram below:
The ingestion job then sends a notification about the new segment to the controller, which in turn notifies the appropriate server to pull down that segment.
For real-time tables, by default, a segment is first built-in memory by the server. It is then uploaded to the lead controller (as part of the Segment Completion Protocol sequence), which writes the segment into the deep store, as shown in the diagram below:
Having all segments go through the controller can become a system bottleneck under heavy load, in which case you can use the peer download policy, as described in .
When using this configuration the server will directly write a completed segment to the deep store, as shown in the diagram below:
For hands-on examples of how to configure the deep store, see the following tutorials:
Running on public clouds
This page contains multiple quick start guides for deploying Pinot to a public cloud provider.
The following quick start guides will show you how to run an Apache Pinot cluster using Kubernetes on different public cloud providers.
Frequently Asked Questions (FAQs)
This page has a collection of frequently asked questions with answers from the community.
This is a list of frequent questions most often asked in our troubleshooting channel on Slack. Please feel free to contribute your questions and answers here and make a pull request.
Server sends segment to Controller, which writes segments into the deep store
Server writing a segment into the deep store
Getting Started
This section contains quick start guides to help you get up and running with Pinot.
Running Pinot
To simplify the getting started experience, Pinot ships with quick start guides that launch Pinot components in a single process and import pre-built datasets.
Getting data into Pinot is easy. Take a look at these two quick start guides which will help you get up and running with sample data for offline and real-time tables.
When data is pushed in to Pinot, it makes a backup copy of the data and stores it on the configured deep-storage (S3/GCP/ADLS/NFS/etc). This copy is stored as tar.gz Pinot segments. Note, that pinot servers keep a (untarred) copy of the segments on their local disk as well. This is done for performance reasons.
How does Pinot use Zookeeper?
Pinot uses Apache Helix for cluster management, which in turn is built on top of Zookeeper. Helix uses Zookeeper to store the cluster state, including Ideal State, External View, Participants, etc. Besides that, Pinot uses Zookeeper to store other information such as Table configs, schema, Segment Metadata, etc.
Why am I getting "Could not find or load class" error when running Quickstart using 0.8.0 release?
Please check the JDK version you are using. The release 0.8.0 binary is on JDK 11. You may be getting this error if you are using JDK8. In that case, please consider using JDK11, or you will need to download the source code for the release and build it locally.
0.9.1
Summary
This release fixes the major issue of CVE-2021-44228 and a major bug fixing of pinot admin exit code issue(#7798).
The release is based on the release 0.9.0 with the following cherry-picks:
The 0.1.0 is first release of Pinot as an Apache project
New Features
First release
Off-line data ingestion from Apache Hadoop
Real-time data ingestion from Apache Kafka
and
latencies are expected to be in milliseconds
for good user-experience.
And further do all of the above, while being scalable, reliable, highly available, and having a low cost to serve.
Near real-time ingestion from streams such as Kafka, Kinesis and batch ingestion from sources such as Hadoop, S3, Azure, GCS
SQL-like language that supports selection, aggregation, filtering, group by, order by, distinct queries on data
Support for multi-valued fields
Horizontally scalable and fault-tolerant
SELECT sum(clicks), sum(impressions) FROM AdAnalyticsTable
WHERE
((daysSinceEpoch >= 17849 AND daysSinceEpoch <= 17856)) AND
accountId IN (123456789)
GROUP BY
daysSinceEpoch TOP 100
User-Facing Real-Time Analytics
Why is user-facing real-time analytics is so challenging?
A tenant is a logical component defined as a group of server/broker nodes with the same Helix tag.
In order to support multi-tenancy, Pinot has first-class support for tenants. Every table is associated with a server tenant and a broker tenant. This controls the nodes that will be used by this table as servers and brokers. This allows all tables belonging to a particular use case to be grouped under a single tenant name.
The concept of tenants is very important when the multiple use cases are using Pinot and there is a need to provide quotas or some sort of isolation across tenants. For example, consider we have two tables Table A and Table B in the same Pinot cluster.
Defining tenants for tables
We can configure Table A with server tenant Tenant A and Table B with server tenant Tenant B. We can tag some of the server nodes for Tenant A and some for Tenant B. This will ensure that segments of Table A only reside on servers tagged with Tenant A, and segment of Table B only reside on servers tagged with Tenant B. The same isolation can be achieved at the broker level, by configuring broker tenants to the tables.
No need to create separate clusters for every table or use case!
This tenant is defined in the section of the table config.
This section contains 2 main fields broker and server , which decide the tenants used for the broker and server components of this table.
In the above example:
The table will be served by brokers that have been tagged as brokerTenantName_BROKER in Helix.
If this were an offline table, the offline segments for the table will be hosted in Pinot servers tagged in Helix as serverTenantName_OFFLINE
If this were a real-time table, the real-time segments (both consuming as well as completed ones) will be hosted in pinot servers tagged in Helix as
Here's a sample broker tenant config. This will create a broker tenant sampleBrokerTenant by tagging 3 untagged broker nodes as sampleBrokerTenant_BROKER.
To create this tenant use the following command. The creation will fail if number of untagged broker nodes is less than numberOfInstances.
Follow instructions in to get Pinot locally, and then
Check out the table config in the to make sure it was successfully uploaded.
Here's a sample server tenant config. This will create a server tenant sampleServerTenant by tagging 1 untagged server node as sampleServerTenant_OFFLINE and 1 untagged server node as sampleServerTenant_REALTIME.
To create this tenant use the following command. The creation will fail if number of untagged server nodes is less than offlineInstances + realtimeInstances.
Follow instructions in to get Pinot locally, and then
Check out the table config in the to make sure it was successfully uploaded.
Import Data
This section is an overview of the various options for importing data into Pinot.
There are multiple options for importing data into Pinot. These guides are ready-made examples that show you step-by-step instructions for importing records into Pinot, supported by our plugin architecture.
These guides are meant to get you up and running with imported data as quick as possible. Pinot supports multiple file input formats without needing to change anything other than the file name. Each example imports a ready-made dataset so you can see how things work without needing to bring your own dataset.
This guide will show you how to import data using stream ingestion with CLP.
By default, Pinot does not come with a storage layer, so all the data sent, won't be stored in case of system crash. In order to persistently store the generated segments, you will need to change controller and server configs to add a deep storage. Checkout for all the info and related configs.
These guides will show you how to import data as well as persist it in the file systems.
These guides will show you how to import data from a Pinot supported input format.
This guide will show you how to handle the complex type in the ingested data, such as map and array.
Range Index
Range indexing allows you to get better performance for queries that involve filtering over a range.
It would be useful for a query like the following:
SELECT COUNT(*)
FROM baseballStats
WHERE hits > 11
A range index is a variant of an inverted index, where instead of creating a mapping from values to columns, we create mapping of a range of values to columns. You can use the range index by setting the following config in the table config.
Pinot offers various ways to assist with troubleshooting and debugging problems that might happen. It is recommended to start off with the debug api which may quickly surface some of the commonly occurring problems. The debug api provides information such as tableSize, ingestion status, any error messages related to state transition in server, among other things.
The table debug api can be invoked via the Swagger UI as follows:
It can also be invoked directly by accessing the URL as follows. The api requires the tableName, and can optionally take tableType (offline|realtime) and verbosity level.
Pinot also provides a wide-variety of operational metrics that can be used for creating dashboards, alerting and
From Query Console
Ensure you have available Pinot Minion instances deployed within the cluster.
Pinot version is 0.11.0 or above
Parse the query with the table name and directory URI along with a list of options for the ingestion job.
Backfill Data
Pinot batch ingestion involves two parts: routing ingestion job(hourly/daily) and backfill. Here are some tutorials on how routine batch ingestion works in Pinot Offline Table:
High Level Idea
0.9.2
This is a bug fixing release contains:
Upgrade log4j to 2.16.0 to fix ()
Upgrade swagger-ui to 3.23.11 to fix ()
Inverted Index
When an inverted index is enabled for a column, Pinot maintains a map from each value to a bitmap of rows, which makes value lookup take constant time. If you have a column that is frequently used for filtering, adding an inverted index will improve performance greatly.
An inverted index can be configured for a table by setting it in the :
A sorted forward index can directly be used as an inverted index, with log(n) time lookup and it can benefit from data locality.
For the below example, if the query has a filter on memberId, Pinot will perform a binary search on memberId values to find the range pair of docIds for corresponding filtering value. If the query needs to scan values for other columns after filtering, values within the range docId pair will be located together, which means we can benefit from data locality.
The following summarizes Pinot's releases, from the latest one to the earliest one.
Note
Before upgrading from one version to another one, please read the release notes. While the Pinot committers strive to keep releases backward-compatible and introduce new features in a compatible manner, your environment may have a unique combination of configurations/data/schema that may have been somehow overlooked. Before you roll out a new release of Pinot on your cluster, it is best that you run the compatibility test suite that Pinot provides. The tests can be easily customized to suit the configurations and tables in your pinot cluster(s). As a good practice, you should build your own test suite, mirroring the table configurations, schema, sample data, and queries that are used in your cluster.
Organize raw data into buckets (eg: /var/pinot/airlineStats/rawdata/2014/01/01). Each bucket typically contains several files (eg: /var/pinot/airlineStats/rawdata/2014/01/01/airlineStats_data_2014-01-01_0.avro)
Run a Pinot batch ingestion job, which points to a specific date folder like ‘/var/pinot/airlineStats/rawdata/2014/01/01’. The segment generation job will convert each such avro file into a Pinot segment for that day and give it a unique name.
Run Pinot segment push job to upload those segments with those uniques names via a Controller API
This newly uploaded data can now be queried in Pinot. However, sometimes users will make changes to the raw data which need to be reflected in Pinot. This process is known as 'Backfill'.
Pinot supports data modification only at the segment level, which means we should update entire segments for doing backfills. The high level idea is to repeat steps 2 (segment generation) and 3 (segment upload) mentioned above:
Backfill jobs must run at the same granularity as the daily job. E.g., if you need to backfill data for 2014/01/01, specify that input folder for your backfill job (e.g.: ‘/var/pinot/airlineStats/rawdata/2014/01/01’)
The backfill job will then generate segments with the same name as the original job (with the new data).
When uploading those segments to Pinot, the controller will replace the old segments with the new ones (segment names act like primary keys within Pinot) one by one.
Backfill jobs expect the same number of (or more) data files on the backfill date. So the segment generation job will create the same number of (or more) segments than the original run.
E.g. assuming table airlineStats has 2 segments(airlineStats_2014-01-01_2014-01-01_0, airlineStats_2014-01-01_2014-01-01_1) on date 2014/01/01 and the backfill input directory contains only 1 input file. Then the segment generation job will create just one segment: airlineStats_2014-01-01_2014-01-01_0. After the segment push job, only segment airlineStats_2014-01-01_2014-01-01_0 got replaced and stale data in segment airlineStats_2014-01-01_2014-01-01_1 are still there.
In case the raw data is modified in such a way that the original time bucket has fewer input files than the first ingestion run, backfill will fail.
IMPORTANT: The segment name is the unique identifier used to uniquely identify that segment in Pinot. If the controller gets an upload request for a segment with the same name - it will attempt to replace it with the new one.
. Also, all pinot components log debug information related to error conditions that can be used for troubleshooting.
Please use these steps:
If the query executes, look at the query result. Specifically look at numEntriesScannedInFilter and numDocsScanned.
If numEntriesScannedInFilter is very high, consider adding indexes for the corresponding columns being used in the filter predicates. You should also think about partitioning the incoming data based on the dimension most heavily used in your filter queries.
If numDocsScanned is very high, that means the selectivity for the query is low and lots of documents need to be processed after the filtering. Consider refining the filter to increase the selectivity of the query.
If the query is not executing, you can extend the query timeout by appending a timeoutMs parameter to the query (eg: select * from mytable limit 10 option(timeoutMs=60000)). Then you can repeat step 1.
You can also look at GC stats for the corresponding Pinot servers. If a particular server seems to be running full GC all the time, you can do a couple of things such as
Increase JVM heap (Xmx)
Consider using off-heap memory for segments
curl -X GET "http://localhost:9000/debug/tables/airlineStats?verbosity=0" -H "accept: application/json"
Is there any debug information available in Pinot?
Swagger - Table Debug Api
How do I debug a slow query or a query which keeps timing out
SET taskName = 'myTask-s3';
SET input.fs.className = 'org.apache.pinot.plugin.filesystem.S3PinotFS';
SET input.fs.prop.accessKey = 'my-key';
SET input.fs.prop.secretKey = 'my-secret';
SET input.fs.prop.region = 'us-west-2';
INSERT INTO "baseballStats"
FROM FILE 's3://my-bucket/public_data_set/baseballStats/rawdata/'
Usage Syntax
Example
Insert Rows into Pinot
_images/sorted-inverted.png
A sorted index performs much better than an inverted index, but it can only be applied to one column per table. When the query performance with an inverted index is not good enough and most queries are filtering on the same column (e.g. memberId), a sorted index can improve the query performance.
Learn about the various components of Pinot and terminologies used to describe data stored in Pinot
Pinot is designed to deliver low latency queries on large datasets. In order to achieve this performance, Pinot stores data in a columnar format and adds additional indices to perform fast filtering, aggregation and group by.
Raw data is broken into small data shards and each shard is converted into a unit known as a segment. One or more segments together form a table, which is the logical container for querying Pinot using SQL/PQL.
Pinot Storage Model
Pinot uses a variety of terms that can refer to either abstractions that model the storage of data or infrastructure components that drive the functionality of the system.
Pinot Storage Model Abstraction
Table
Similar to traditional databases, Pinot has the concept of a table—a logical abstraction to refer to a collection of related data.
As is the case with RDBMS, a table is a construct that consists of columns and rows (documents) that are queried using SQL. A table is associated with a that defines the columns in a table as well as their data types.
In contrast to RDBMS schemas, multiple tables in Pinot (real-time or batch) can inherit a single schema definition. Tables are independently configured for concerns such as indexing strategies, partitioning, tenants, data sources, and/or replication.
Pinot has a distributed systems architecture that scales horizontally. Pinot expects the size of a table to grow infinitely over time. In order to achieve this, all data needs to be distributed across multiple nodes. Pinot achieves this by breaking data into smaller chunks known as (similar to shards/partitions in HA relational databases). Segments can also be seen as time-based partitions.
In order to support multi-tenancy, Pinot has first class support for tenants. A table is associated with a This allows all tables belonging to a particular logical namespace to be grouped under a single tenant name and isolated from other tenants. This isolation between tenants provides different namespaces for applications and teams to prevent sharing tables or schemas. Development teams building applications will never have to operate an independent deployment of Pinot. An organization can operate a single cluster and scale it out as new tenants increase the overall volume of queries. Developers can manage their own schemas and tables without being impacted by any other tenant on a cluster.
By default, all tables belong to a default tenant named "default". The concept of tenants is very important, as it satisfies the architectural principle of a "database per service/application" without having to operate many independent data stores. Further, tenants will schedule resources so that segments (shards) are able to restrict a table's data to reside only on a specified set of nodes. Similar to the kind of isolation that is ubiquitously used in Linux containers, compute resources in Pinot can be scheduled to prevent resource contention between tenants.
Logically, a is simply a group of tenants. As with the classical definition of a cluster, it is also a grouping of a set of compute nodes. Typically, there is only one cluster per environment/data center. There is no needed to create multiple clusters since Pinot supports the concept of tenants. At LinkedIn, the largest Pinot cluster consists of 1000+ nodes distributed across a data center. The number of nodes in a cluster can be added in a way that will linearly increase performance and availability of queries. The number of nodes and the compute resources per node will reliably predict the QPS for a Pinot cluster, and as such, capacity planning can be easily achieved using SLAs that assert performance expectations for end-user applications.
A Pinot cluster comprises multiple distributed system components. These components are useful to understand for operators that are monitoring system usage or are debugging an issue with a cluster deployment.
Controller
Server
Broker
The benefits of scale that make Pinot linearly scalable for an unbounded number of nodes is made possible through its integration with and .
A is the core orchestrator that drives the consistency and routing in a Pinot cluster. Controllers are horizontally scaled as an independent component (container) and has visibility of the state of all other components in a cluster. The controller reacts and responds to state changes in the system and schedules the allocation of resources for tables, segments, or nodes. As mentioned earlier, Helix is embedded within the controller as an agent that is a participant responsible for observing and driving state changes that are subscribed to by other components.
In addition to cluster management, resource allocation, and scheduling, the controller is also the HTTP gateway for REST API administration of a Pinot deployment. A web-based query console is also provided for operators to quickly and easily run SQL/PQL queries.
A receives queries from a client and routes their execution to one or more Pinot servers before returning a consolidated response.
host segments (shards) that are scheduled and allocated across multiple nodes and routed on an assignment to a tenant (there is a single-tenant by default). Servers are independent containers that scale horizontally and are notified by Helix through state changes driven by the controller. A server can either be a real-time server or an offline server.
A real-time and offline server have very different resource usage requirements, where real-time servers are continually consuming new messages from external systems (such as Kafka topics) that are ingested and allocated on segments of a tenant. Because of this, resource isolation can be used to prioritize high-throughput real-time data streams that are ingested and then made available for query through a broker.
Pinot is an optional component that can be used to run background tasks such as "purge" for GDPR (General Data Protection Regulation). As Pinot is an immutable aggregate store, records containing sensitive private data need to be purged on a request-by-request basis. Minion provides a solution for this purpose that complies with GDPR while optimizing Pinot segments and building additional indices that guarantee performance in the presence of the possibility of data deletion. One can also write a custom task that runs on a periodic basis. While it's possible to perform these tasks on the Pinot servers directly, having a separate process (Minion) lessens the overall degradation of query latency as segments are impacted by mutable writes.
Pinot On Kubernetes FAQ
How to increase server disk size on AWS
Below is an example of AWS EKS.
1. Update Storage Class
In the K8s cluster, check the storage class: in AWS, it should be gp2.
Then update StorageClass to ensure:
allowVolumeExpansion: true
Once StorageClass is updated, it should be like:
2. Update PVC
Once the storage class is updated, then we can update PVC for the server disk size.
Now we want to double the disk size for pinot-server-3.
Below is an example of current disks:
Below is the output of data-pinot-server-3
Now, let's change the PVC size to 2T by editing the server PVC.
Once updated, the spec's PVC size is updated to 2T, but the status's PVC size is still 1T.
Restart pinot-server-3 pod:
Recheck PVC size:
Native Text Index
This page talks about native text indices and corresponding search functionality in Pinot
History Of Text Indexing And Search in Pinot
Pinot supports text indexing and search by building Lucene indices as "sidecars" to the main Pinot segments. While this is a great technique, it essentially limits the avenues of optimizations that can be done for Pinot specific use cases of text search.
How Is Pinot Different?
Pinot, or any other database/OLAP engine, do not need to conform to the entire full text search DSL that is traditionally used by FTS engines like ElasticSearch and Solr. Looking at traditional SQL like text search use cases, majority of text searches comprise of three patterns -- prefix wildcard queries, postfix wildcard queries and term queries.
Native Text Indices in Pinot
Native text indices are built from the ground up. They use a custom text indexing engine, coupled with Pinot's powerful inverted indices, to provide a super fast text search experience.
Benefits of Native Text Indices
Native text indices are 80-120% faster than Lucene based indices for the text search use cases mentioned above. They are also 40% smaller on disk.
Real Time Indexing And Search
A new feature that native text indices support are real time text search. For REALTIME tables, native text indices allow data to be indexed in memory in the text index, while concurrently supporting text searches on the same index.
Historically, most text indices depend on the in memory text index being written to first and then sealed, before searches are possible. This limits the freshness of the search, being near real time at best.
Native text indices come with a custom in memory text index, which allows for real time indexing and search.
A new function, TEXT_CONTAINS, is introduced for supporting text search on native text indices.
Examples:
TEXT_CONTAINS can be combined using standard boolean operators
Note that TEXT_CONTAINS supports regex and term queries for now. Also, TEXT_CONTAINS will work only on native indices.
Note that TEXT_CONTAINS supports standard regex patterns (as used by LIKE in SQL Standard). So there might be some syntatical changes from Lucene queries
Native text indices are a type of text search index that Pinot supports, hence are created through the regular way of using field configs to configure a text index on a given field. To indicate that the index type is native, an additional property in the field config has to be specified:
Bloom Filter
Bloom filter helps prune segments that do not contain any record matching an EQUALITY predicate.
It would be useful for a query like the following:
SELECT COUNT(*)
FROM baseballStats
WHERE playerID = 12345
There are 3 parameters to configure the Bloom Filter:
fpp: False positive probability of the bloom filter (from 0 to 1, 0.05 by default). The lower the fpp , the higher accuracy the bloom filter has, but it will also increase the size of the bloom filter.
maxSizeInBytes: Maximum size of the bloom filter (unlimited by default). If a certain fpp generates a bloom filter larger than this size, we will increase the fpp to keep the bloom filter size within this limit.
loadOnHeap: Whether to load the bloom filter using heap memory or off-heap memory (false by default).
There are 2 ways to configure a bloom filter for a table in the :
Default settings
Customized parameters
A Bloom Filter can only be applied to . Support for raw value columns is WIP.
Dimension Table
Dimension tables in Apache Pinot.
Dimension tables are a special kind of offline tables from which data can be looked up via the lookup UDF, providing join like functionality.
Dimension tables are replicated on all the hosts for a given tenant to allow faster lookups.
To mark an offline table as a dim table, isDimTable should be set to true and segmentsConfig.segementPushType should be set to REFRESH in the table config as shown below:
When a table is marked as a dimension table, it will be replicated on all the hosts, which means that these tables must be small in size.
The maximum size quota for a dimension table in a cluster is controlled by the controller.dimTable.maxSize controller property. Table creation will fail if the storage quota exceeds this maximum size.
A dimension table cannot be part of a .
File Systems
This section contains a collection of short guides to show you how to import from a Pinot supported file system.
FileSystem is an abstraction provided by Pinot to access data in distributed file systems (DFS).
Pinot uses distributed file systems for the following purposes:
Batch Ingestion Job - To read the input data (CSV, Avro, Thrift, etc.) and to write generated segments to DFS
Controller - When a segment is uploaded to the controller, the controller saves it in the DFS configured.
Server - When a server(s) is notified of a new segment, the server copies the segment from remote DFS to their local node using the DFS abstraction.
Pinot lets you choose a distributed file system provider. The following file systems are supported by Pinot:
To use a distributed file system, you need to enable plugins. To do that, specify the plugin directory and include the required plugins -
Now, You can proceed to change the filesystem in the controller and server config as shown below:
scheme refers to the prefix used in the URI of the filesystem. e.g. for the URI s3://bucket/path/to/file , the scheme is s3
You can also change the filesystem during ingestion. In the ingestion job spec, specify the filesystem with the following config:
Running on Azure
This starter guide provides a quick start for running Pinot on Microsoft Azure
This document provides the basic instruction to set up a Kubernetes Cluster on
Please follow this link () to install kubectl.
For Mac User
Please check kubectl version after installation.
Please follow this link () to install helm.
For Mac User
Running on GCP
This starter provides a quick start for running Pinot on Google Cloud Platform (GCP)
This document provides the basic instruction to set up a Kubernetes Cluster on
Please follow this link () to install kubectl.
For Mac User
Please check kubectl version after installation.
Please follow this link () to install helm.
For Mac User
HDFS as Deep Storage
This guide helps to setup HDFS as deepstorage for Pinot Segment.
To use HDFS as deep storage you need to include HDFS dependency jars and plugins.
Flink
Pinot supports Apache Flink as a processing framework to push segment files to the database.
Pinot distribution contains an Apache Flink that can be used as part of the Apache Flink application (Streaming or Batch) to directly write into a designated Pinot database.
Here is an example code snippet to show how to utilize the in a Flink streaming application:
As the example shown above, the only required information from the Pinot side is the table and the table .
For a more detail executable please refer to the .
PinotSinkFunction uses mostly the TableConfig object to infer the batch ingestion configuration to start a SegmentWriter and SegmentUploader to communicate with the Pinot cluster.
Apache Pulsar
Pinot supports consuming data from via pinot-pulsar plugin. You need to enable this plugin so that Pulsar specific libraries are present in the classpath.
You can enable pulsar plugin with the following config at the time of Pinot setup
-Dplugins.include=pinot-pulsar
A sample Pulsar stream config to ingest data should look as follows. You can use the streamConfigs section from this sample and make changes for your corresponding table.
Stream Ingestion with Dedup
Deduplication support in Apache Pinot.
Pinot provides native support of Deduplication during the real-time ingestion (v0.11.0+).
To enable dedup on a Pinot table, there are a couple of table configuration and schema changes needed.
There are certain mandatory configurations needed in order to be able to enable dedup.
To be able to dedup records, a primary key is needed to uniquely identify a given record. To define a primary key, add the field primaryKeyColumns to the schema definition.
Note this field expects a list of columns, as the primary key can be composite.
While ingesting a record, if its primary key is found to be already present, the record will be dropped.
Azure Data Lake Storage
This guide shows you how to import data from files stored in Azure Data Lake Storage Gen2 (ADLS Gen2)
You can enable the Azure Data Lake Storage using the plugin pinot-adls. In the controller or server, add the config -
Azure Blob Storage provides the following options -
accountName : Name of the azure account under which the storage is created
Indexing
This page describes the different indexing techniques available in Pinot
Pinot supports the following indexing techniques:
Dictionary-encoded forward index with bit compression
This QuickStart provides helm supports for helm v3.0.0 and v2.12.1. Please pick the script based on your helm version.
1.3 Install Google Cloud SDK
1.3.1 For Mac User
2. (Optional) Initialize Google Cloud Environment
3. (Optional) Create a Kubernetes cluster(GKE) in Google Cloud
4. Connect to an existing cluster
5. Pinot Quickstart
6. Delete a Kubernetes Cluster
Note that even though in the above example Flink application is running in streaming mode, the data is still batch together and flush/upload to Pinot once the flush threshold is reached. It is not a direct streaming write into Pinot.
Here is an example table config
the only required configurations are:
"outputDirURI": where PinotSinkFunction should write the constructed segment file to
"push.controllerUri": which Pinot cluster (controller) URL PinotSinkFunction should communicate with.
The rest of the configurations are standard for any Pinot table.
An important requirement for the Pinot dedup table is to partition the input stream by the primary key. For Kafka messages, this means the producer shall set the key in the send API. If the original stream is not partitioned, then a streaming processing job (e.g. Flink) is needed to shuffle and repartition the input stream into a partitioned one for Pinot's ingestion.
The dedup Pinot table can use only the low-level consumer for the input streams. As a result, it uses the partitioned replica-group assignment for the segments. Moreover, dedup poses the additional requirement that all segments of the same partition must be served from the same server to ensure the data consistency across the segments. Accordingly, it requires strictReplicaGroup as the routing strategy. To use that, configure instanceSelectorType in Routing as the following:
The high-level consumer is not allowed for the input stream ingestion, which means stream.kafka.consumer.type must be lowLevel.
The incoming stream must be partitioned by the primary key such that, all records with a given primaryKey must be consumed by the same Pinot server instance.
To enable dedup for a REALTIME table, add the following to the table config.
Supported values for hashFunction are NONE, MD5 and MURMUR3, with the default being NONE.
Unlike other real-time tables, Dedup table takes up more memory resources as it needs to bookkeep the primary key and its corresponding segment reference, in memory. As a result, it's important to plan the capacity beforehand, and monitor the resource usage. Here are some recommended practices of using Dedup table.
Create the Kafka topic with more partitions. The number of Kafka partitions determines the partition numbers of the Pinot table. The more partitions you have in the Kafka topic, more Pinot servers you can distribute the Pinot table to and therefore more you can scale the table horizontally.
Dedup table maintains an in-memory map from the primary key to the segment reference. So it's recommended to use a simple primary key type and avoid composite primary keys to save the memory cost. In addition, consider the hashFunction config in the Dedup config, which can be MD5 or MURMUR3, to store the 128-bit hashcode of the primary key instead. This is useful when your primary key takes more space. But keep in mind, this hash may introduce collisions, though the chance is very low.
Monitoring: Set up a dashboard over the metric pinot.server.dedupPrimaryKeysCount.tableName to watch the number of primary keys in a table partition. It's useful for tracking its growth which is proportional to the memory usage growth.
Capacity planning: It's useful to plan the capacity beforehand to ensure you will not run into resource constraints later. A simple way is to measure the amount of the primary keys in the Kafka throughput per partition and time the primary key space cost to approximate the memory usage. A heap dump is also useful to check the memory usage so far on an dedup table instance.
Prerequisites for enabling dedup
Define the primary key in the schema
Partition the input stream by the primary key
Use strictReplicaGroup for routing
Other limitations
Enable dedup in the table configurations
Best practices
accessKey : access key required for the authentication
fileSystemName - name of the filesystem to use i.e. container name (container name is similar to bucket name in S3)
enableChecksum - enable MD5 checksum for verification. Default is false.
Each of these properties should be prefixed by pinot.[node].storage.factory.class.adl2. where node is either controller or server depending on the config
e.g.
By default Pinot loads all the plugins, so you can just drop this plugin there. Also, if you specify -Dplugins.include, you need to put all the plugins you want to use, e.g. pinot-json, pinot-avro , pinot-kafka-2.0...
Examples
Job spec
Controller config
Server config
Minion config
SELECT COUNT(*) FROM Foo WHERE TEXT_CONTAINS (<column_name>, <search_expression>)
SELECT COUNT(*) FROM Foo WHERE TEXT_CONTAINS (<column_name>, "foo.*")
SELECT COUNT(*) FROM Foo WHERE TEXT_CONTAINS (<column_name>, ".*bar")
SELECT COUNT(*) FROM Foo WHERE TEXT_CONTAINS (<column_name>, "foo")
SELECT COUNT(*) FROM Foo WHERE TEXT_CONTAINS ("col1", "foo") AND TEXT_CONTAINS ("col2", "bar")
#CONTROLLER
pinot.controller.storage.factory.class.[scheme]=className of the pinot file systems
pinot.controller.segment.fetcher.protocols=file,http,[scheme]
pinot.controller.segment.fetcher.[scheme].class=org.apache.pinot.common.utils.fetcher.PinotFSSegmentFetcher
#SERVER
pinot.server.storage.factory.class.[scheme]=className of the pinotfile systems
pinot.server.segment.fetcher.protocols=file,http,[scheme]
pinot.server.segment.fetcher.[scheme].class=org.apache.pinot.common.utils.fetcher.PinotFSSegmentFetcher
AKS_RESOURCE_GROUP=pinot-demo
AKS_RESOURCE_GROUP_LOCATION=eastus
az group create --name ${AKS_RESOURCE_GROUP} \
--location ${AKS_RESOURCE_GROUP_LOCATION}
AKS_RESOURCE_GROUP=pinot-demo
AKS_CLUSTER_NAME=pinot-quickstart
az aks create --resource-group ${AKS_RESOURCE_GROUP} \
--name ${AKS_CLUSTER_NAME} \
--node-count 3
AKS_RESOURCE_GROUP=pinot-demo
AKS_CLUSTER_NAME=pinot-quickstart
az aks get-credentials --resource-group ${AKS_RESOURCE_GROUP} \
--name ${AKS_CLUSTER_NAME}
kubectl get nodes
AKS_RESOURCE_GROUP=pinot-demo
AKS_CLUSTER_NAME=pinot-quickstart
az aks delete --resource-group ${AKS_RESOURCE_GROUP} \
--name ${AKS_CLUSTER_NAME}
Decrease the total number of segments per server (by partitioning the data in a better way)
Minion (optional)
Segment
Tenant
Cluster
Auto-scaling is also achievable, however, a set amount of nodes is recommended to keep QPS consistent when query loads vary in sudden unpredictable end-user usage scenarios.
Pinot Components
Helix is a cluster management solution that was designed and created by the authors of Pinot at LinkedIn. Helix drives the state of a Pinot cluster from a transient state to an ideal state, acting as the fault-tolerant distributed state store that guarantees consistency. Helix is embedded as agents that operate within a controller, broker, and server, and does not exist as an independent and horizontally scaled component.
You can change the following Pulsar specifc configurations for your tables
Property
Description
streamType
This should be set to "pulsar"
stream.pulsar.topic.name
Your pulsar topic name
stream.pulsar.bootstrap.servers
Pinot-Pulsar connector supports authentication using the security tokens. You can generate the token by following the official Pulsar documentaton. Once generated, you can add the following property to streamConfigs to add auth token for each request
Pinot-pulsar connecor also supports TLS for encrypted connections. You can follow the official pulsar documentation to enable TLS on your pulsar cluster. Once done, you can enable TLS in pulsar connector by providing the trust certificate file location generated in the previous step.
Also, make sure to change the brokers url from pulsar://localhost:6650 to pulsar+ssl://localhost:6650 so that secure connections are used.
pinot-pulsar plugin is not part of official 0.10.0 binary. You can download the plugin from our external repository and add it to libs or plugins directory in pinot.
Each of these techniques has advantages in different query scenarios. By default, Pinot creates a dictionary-encoded forward index for each column.
There are 2 ways to create indexes for a Pinot table.
Indexing is enabled by specifying the desired column names in the table config. More details about how to configure each type of index can be found in the respective index's section above or in the Table Config section.
Indexes can also be dynamically added to or removed from segments at any point. Update your table config with the latest set of indexes you wish to have.
For example, if you have an inverted index on the foo field and now want to include the bar field, you would update your table config from this:
To this:
The updated index config won't be picked up unless you invoke the reload API. This API sends reload messages via Helix to all servers, as part of which indexes are added or removed from the local segments. This happens without any downtime and is completely transparent to the queries.
When adding an index, only the new index is created and appended to the existing segment. When removing an index, its related states are cleaned up from Pinot servers. You can find this API under the Segments tab on Swagger:
The inverted index provides good performance for most use cases, especially if your use case doesn't have a strict low latency requirement.
You should start by using this, and if your queries aren't fast enough, switch to advanced indices like the sorted or Star-Tree index.
The first screen that you'll see when you open the Pinot Data Explorer is the Cluster Manager. The Cluster Manager provides a UI to operate and manage your cluster.
Pinot Cluster Manager
If you want to view the contents of a server, click on its instance name. You'll then see the following:
Pinot Server
To view the baseballStats table, click on its name, which will show the following screen:
From this screen, we can edit or delete the table, edit or adjust its schema, as well as several other operations.
For example, if we want to add yearID to the list of inverted indexes, click on Edit Table, add the extra column, and click Save:
Let us run some queries on the data in the Pinot cluster. Head over to to see the querying interface.
We can see our baseballStats table listed on the left (you will see meetupRSVP or airlineStats if you used the streaming or the hybrid ). Click on the table name to display all the names along with the data types of the columns of the table.
You can also execute a sample query select * from baseballStats limit 10 by typing it in the text box and clicking the Run Query button.
Cmd + Enter can also be used to run the query when focused on the console.
You can also try out the following queries:
Pinot supports a subset of standard SQL. For more information, see .
The contains all the APIs that you will need to operate and manage your cluster. It provides a set of APIs for Pinot cluster management including health check, instances management, schema and table management, data segments management.
Let's check out the tables in this cluster by going to , click Try it out, and then click Execute. We can see thebaseballStats table listed here. We can also see the exact cURL call made to the controller API.
You can look at the configuration of this table by going to , click Try it out, type baseballStats in the table name, and then click Execute.
Let's check out the schemas in the cluster by going to , click Try it out, and then click Execute. We can see a schema called baseballStats in this list.
Take a look at the schema by going to , click Try it out, type baseballStats in the schema name, and then click Execute.
Finally, let's check out the data segments in the cluster by going to , click Try it out, type in baseballStats in the table name, and then click Execute. There's 1 segment for this table, called baseballStats_OFFLINE_0.
To learn how to upload your own data and schema, see or .
Running on AWS
This guide provides a quick start for running Pinot on Amazon Web Services (AWS).
By default Pinot loads all the plugins, so you can just drop this plugin there. Also, if you specify -Dplugins.include, you need to put all the plugins you want to use, e.g. pinot-json, pinot-avro , pinot-kafka-2.0...
GCP filesystems provides the following options -
projectId - The name of the Google Cloud Platform project under which you have created your storage bucket.
gcpKey - Location of the json file containing GCP keys. You can refer to download the keys.
Each of these properties should be prefixed by pinot.[node].storage.factory.class.gs. where node is either controller or server depending on the config
e.g.
Query FAQ
This essentially implies that the Pinot Broker assigned to the table specified in the query was not found. A common root cause for this is a typo in the table name in the query. Another uncommon reason could be if there wasn't actually a broker with required broker tenant tag for the table.
Here's the page explaining the Pinot response format:
"timestamp" is a reserved keyword in SQL. Escape timestamp with double quotes.
Other commonly encountered reserved keywords are date, time, table.
For filtering on STRING columns, use single quotes
The fields in the ORDER BY clause must be one of the group by clauses or aggregations,
HDFS
This guide shows you how to import data from HDFS.
You can enable the using the plugin pinot-hdfs. In the controller or server, add the config:
HDFS implementation provides the following options -
hadoop.conf.path : Absolute path of the directory containing hadoop XML configuration files such as hdfs-site.xml, core-site.xml .
Timestamp Index
Speed up your time query with different granularities
Pinot introduces the TIMESTAMP data type from . This data type stores value as millisecond epoch long value internally.
Typically for analytics queries, users won't need this low level granularity, scanning the data and time value conversion can be costly for the big size of data.
A common query pattern for timestamp columns is filtering on a time range and then group by with different time granularities(days/month/etc).
The existing implementation requires the query executor to extract values, apply the transform functions then do filter/groupBy, no leverage on the dictionary or index.
Hence the inspiration of TIMESTAMP INDEX, which is used to improve the query performance for range query and group by queries on TIMESTAMP columns.
0.2.0
The 0.2.0 release is the first release after the initial one and includes several improvements, reported following.
Added support for Kafka 2.0
Table rebalancer now supports a minimum number of serving replicas during rebalance
Added support for UDF in filter predicates and selection
Amazon Kinesis
To ingest events from an Amazon Kinesis stream into Pinot, set the following configs into the table config
where the Kinesis specific properties are:
Property
Description
Cardinality Estimation
Cardinality estimation is a classic problem. Pinot solves it with multiple ways each of which has a trade-off between accuracy and latency.
Functions:
DistinctCount(x) -> LONG
Returns accurate count for all unique values in a column.
The underlying implementation is using a IntOpenHashSet in library: it.unimi.dsi:fastutil:8.2.3
Query Options
This document contains all the available query options
Set to LATEST to consume only new records, TRIM_HORIZONfor earliest sequencenumber, AT_SEQUENCE_NUMBER and AFTER_SEQUENCE_NUMBER to start consumptions from a particular sequence number
maxRecordsToFetch
... Default is 20.
Kinesis supports authentication using the DefaultCredentialsProviderChain. The credential provider looks for the credentials in the following order -
Environment Variables - AWS_ACCESS_KEY_ID and AWS_SECRET_ACCESS_KEY (RECOMMENDED since they are recognized by all the AWS SDKs and CLI except for .NET), or AWS_ACCESS_KEY and AWS_SECRET_KEY (only recognized by Java SDK)
Java System Properties - aws.accessKeyId and aws.secretKey
Web Identity Token credentials from the environment or container
Credential profiles file at the default location (~/.aws/credentials) shared by all AWS SDKs and the AWS CLI
Credentials delivered through the Amazon EC2 container service if AWS_CONTAINER_CREDENTIALS_RELATIVE_URI environment variable is set and security manager has permission to access the variable,
Instance profile credentials delivered through the Amazon EC2 metadata service
You can also specify the accessKey and secretKey using the properties. However, this method is not secure and should be used only for POC setups. You can also specify other aws fields such as AWS_SESSION_TOKEN as environment variables and config and it will work.
ShardID is of the format "shardId-000000000001". We use the numeric part as partitionId. Our partitionId variable is integer. If shardIds grow beyond Integer.MAX_VALUE, we will overflow
Segment size based thresholds for segment completion will not work. It assumes that partition "0" always exists. However, once the shard 0 is split/merged, we will no longer have partition 0.
streamType
This should be set to "kinesis"
Limitations
BEFORE
applying the alias. Therefore, this will not work
Instead, this will work
No. Pagination only works for SELECTION queries
You can add this at the end of your query: option(timeoutMs=X). For eg: the following example will use a timeout of 20 seconds for the query:
You can also use SET "timeoutMs" = 20000; SELECT COUNT(*) from myTable
For changing timeout on the entire cluster, set this property pinot.broker.timeoutMs in either broker configs or cluster configs (using POST /cluster/configs API from swagger)
Add these two configs for Pinot server and broker to start tracking of running queries. The query tracks are added and cleaned as query starts and ends, so should not consume much resource.
Then use the Rest APIs on Pinot controller to list running queries and cancel them via the query ID and broker ID (as query ID is only local to broker), like below:
In order to speed up aggregations, you can enable metrics aggregation on the required column by adding a metric field in the corresponding schema and setting aggregateMetrics to true in the table config. You can also use a star-tree index config for such columns (read more about star-tree here)
There are 2 ways to verify this:
Log in to a server that hosts segments of this table. Inside the data directory, locate the segment directory for this table. In this directory, there is a file named index_map which lists all the indexes and other data structures created for each segment. Verify that the requested index is present here.
During query: Use the column in the filter predicate and check the value of numEntriesScannedInFilter . If this value is 0, then indexing is working as expected (works for Inverted index)
Yes, Pinot uses a default value of LIMIT 10 in queries. The reason behind this default value is to avoid unintentionally submitting expensive queries that end up fetching or processing a lot of data from Pinot. Users can always overwrite this by explicitly specifying a LIMIT value.
Pinot does not cache query results, each query is computed in its entirety. Note though, running the same or similar query multiple times will naturally pull in segment pages into memory making subsequent calls faster. Also, for realtime systems, the data is changing in realtime, so results cannot be cached. For offline-only systems, caching layer can be built on top of Pinot, with invalidation mechanism built-in to invalidate the cache when data is pushed into Pinot.
Pinot memory maps segments. It warms up during the first query, when segments are pulled into the memory by the OS. Subsequent queries will have the segment already loaded in memory, and hence will be faster. The OS is responsible for bringing the segments into memory, and also removing them in favor of other segments when other segments not already in memory are accessed.
The query execution engine will prefer to use StarTree index for all queries where it can be used. The criteria to determine whether StarTree index can be used is as follows:
All aggregation function + column pairs in the query must exist in the StarTree index.
All dimensions that appear in filter predicates and group-by should be StarTree dimensions.
For queries where above is true, StarTree index is used. For other queries, the execution engine will default to using the next best index available.
Querying
I get the following error when running a query, what does it mean?
What are all the fields in the Pinot query's JSON response?
SQL Query fails with "Encountered 'timestamp' was expecting one of..."
Filtering on STRING column WHERE column = "foo" does not work?
How do I optimize my Pinot table for doing aggregations and group-by on high cardinality columns ?
How do I verify that an index is created on a particular column ?
Does Pinot use a default value for LIMIT in queries?
Does Pinot cache query results?
I'm noticing that the first query is slower than subsequent queries, why is that?
How do I determine if StarTree index is being used for my query?
hadoop.write.checksum : create checksum while pushing an object. Default is false
hadoop.kerberos.principle
hadoop.kerberos.keytab
Each of these properties should be prefixed by pinot.[node].storage.factory.class.hdfs. where node is either controller or server depending on the config
The kerberos configs should be used only if your Hadoop installation is secured with Kerberos. Please check Hadoop Kerberos guide on how to generate Kerberos security identification.
You will also need to provide proper Hadoop dependencies jars from your Hadoop installation to your Pinot startup scripts.
To push HDFS segment files to Pinot controller, you just need to ensure you have proper Hadoop configuration as we mentioned in the previous part. Then your remote segment creation/push job can send the HDFS path of your newly created segment files to the Pinot Controller and let it download the files.
For example, the following curl requests to Controller will notify it to download segment files to the proper table:
Standalone Job:
Hadoop Job:
By default Pinot loads all the plugins, so you can just drop this plugin there. Also, if you specify -Dplugins.include, you need to put all the plugins you want to use, e.g. pinot-json, pinot-avro , pinot-kafka-2.0...
It usually takes a lot of resources and time to compute accurate results for unique counting on large datasets. In some circumstances, we can tolerate a certain error rate, in which case we can use approximation functions to tackle this problem.
HyperLogLog is an approximation algorithm for unique counting. It uses fixed number of bits to estimate the cardinality of given data set.
Pinot leverages HyperLogLog Class in library com.clearspring.analytics:stream:2.7.0as the data structure to hold intermediate results.
Functions:
DistinctCountHLL(x)_ -> LONG_
For column type INT/LONG/FLOAT/DOUBLE/STRING , Pinot treats each value as an individual entry to add into HyperLogLog Object, then compute the approximation by calling method cardinality().
For column type BYTES, Pinot treats each value as a serialized HyperLogLog Object with pre-aggregated values inside. The bytes value is generated by org.apache.pinot.core.common.ObjectSerDeUtils.HYPER_LOG_LOG_SER_DE.serialize(hyperLogLog).
All deserialized HyperLogLog object will be merged into one then calling method **cardinality() **to get the approximated unique count.
The Theta Sketch framework enables set operations over a stream of data, and can also be used for cardinality estimation. Pinot leverages the Sketch Class and its extensions from the library org.apache.datasketches:datasketches-java:1.2.0-incubating to perform distinct counting as well as evaluating set operations.
Functions:
DistinctCountThetaSketch(<thetaSketchColumn>, <thetaSketchParams>, predicate1, predicate2..., postAggregationExpressionToEvaluate**) **-> LONG
thetaSketchColumn (required): Name of the column to aggregate on.
thetaSketchParams (required): Parameters for constructing the intermediate theta-sketches. Currently, the only supported parameter is nominalEntries.
predicates (optional)_: _ These are individual predicates of form lhs <op> rhs which are applied on rows selected by the where clause. During intermediate sketch aggregation, sketches from the thetaSketchColumn that satisfies these predicates are unionized individually. For example, all filtered rows that match country=USA are unionized into a single sketch. Complex predicates that are created by combining (AND/OR) of individual predicates is supported.
postAggregationExpressionToEvaluate (required): The set operation to perform on the individual intermediate sketches for each of the predicates. Currently supported operations are SET_DIFF, SET_UNION, SET_INTERSECT , where DIFF requires two arguments and the UNION/INTERSECT allow more than two arguments.
In the example query below, the where clause is responsible for identifying the matching rows. Note, the where clause can be completely independent of the postAggregationExpression. Once matching rows are identified, each server unionizes all the sketches that match the individual predicates, i.e. country='USA' , device='mobile' in this case. Once the broker receives the intermediate sketches for each of these individual predicates from all servers, it performs the final aggregation by evaluating the postAggregationExpression and returns the final cardinality of the resulting sketch.
This is the same as the previous function, except it returns the byte serialized sketch instead of the cardinality sketch. Since Pinot returns responses as JSON strings, bytes are returned as hex encoded strings. The hex encoded string can be deserialized into sketch by using the library org.apache.commons.codec.binaryas Hex.decodeHex(stringValue.toCharArray()).
SELECT count(colA) as aliasA, colA from tableA GROUP BY colA ORDER BY aliasA
SELECT count(colA) as sumA, colA from tableA GROUP BY colA ORDER BY count(colA)
SELECT COUNT(*) from myTable option(timeoutMs=20000)
pinot.server.enable.query.cancellation=true // false by default
pinot.broker.enable.query.cancellation=true // false by default
GET /queries: to show running queries as tracked by all brokers
Response example: `{
"Broker_192.168.0.105_8000": {
"7": "select G_old from baseballStats limit 10",
"8": "select G_old from baseballStats limit 100"
}
}`
DELETE /query/{brokerId}/{queryId}[?verbose=false/true]: to cancel a running query
with queryId and brokerId. The verbose is false by default, but if set to true,
responses from servers running the query also return.
Response example: `Cancelled query: 8 with responses from servers:
{192.168.0.105:7501=404, 192.168.0.105:7502=200, 192.168.0.105:7500=200}`
select distinctCountThetaSketch(
sketchCol,
'nominalEntries=1024',
'country'=''USA'' AND 'state'=''CA'', 'device'=''mobile'', 'SET_INTERSECT($1, $2)'
)
from table
where country = 'USA' or device = 'mobile...'
TIMESTAMP index can only be created on TIMESTAMP data type.
Users can configure the most useful granularities for a Timestamp data type column.
Pinot will pre-generate one column per time granularity with forward index and range index. The naming convention is $${ts_column_name}$${ts_granularity}, e.g. Timestamp column ts with granularities DAY, MONTH will have two extra columns generated: $ts$DAY and $ts$MONTH.
Query overwrite for predicate and selection/group by:
2.1 GROUP BY: functions like dateTrunc('DAY', ts) will be translated to use the underly column $ts$DAY to fetch data.
2.2 PREDICATE: range index is auto-built for all granularity columns.
Example query usage:
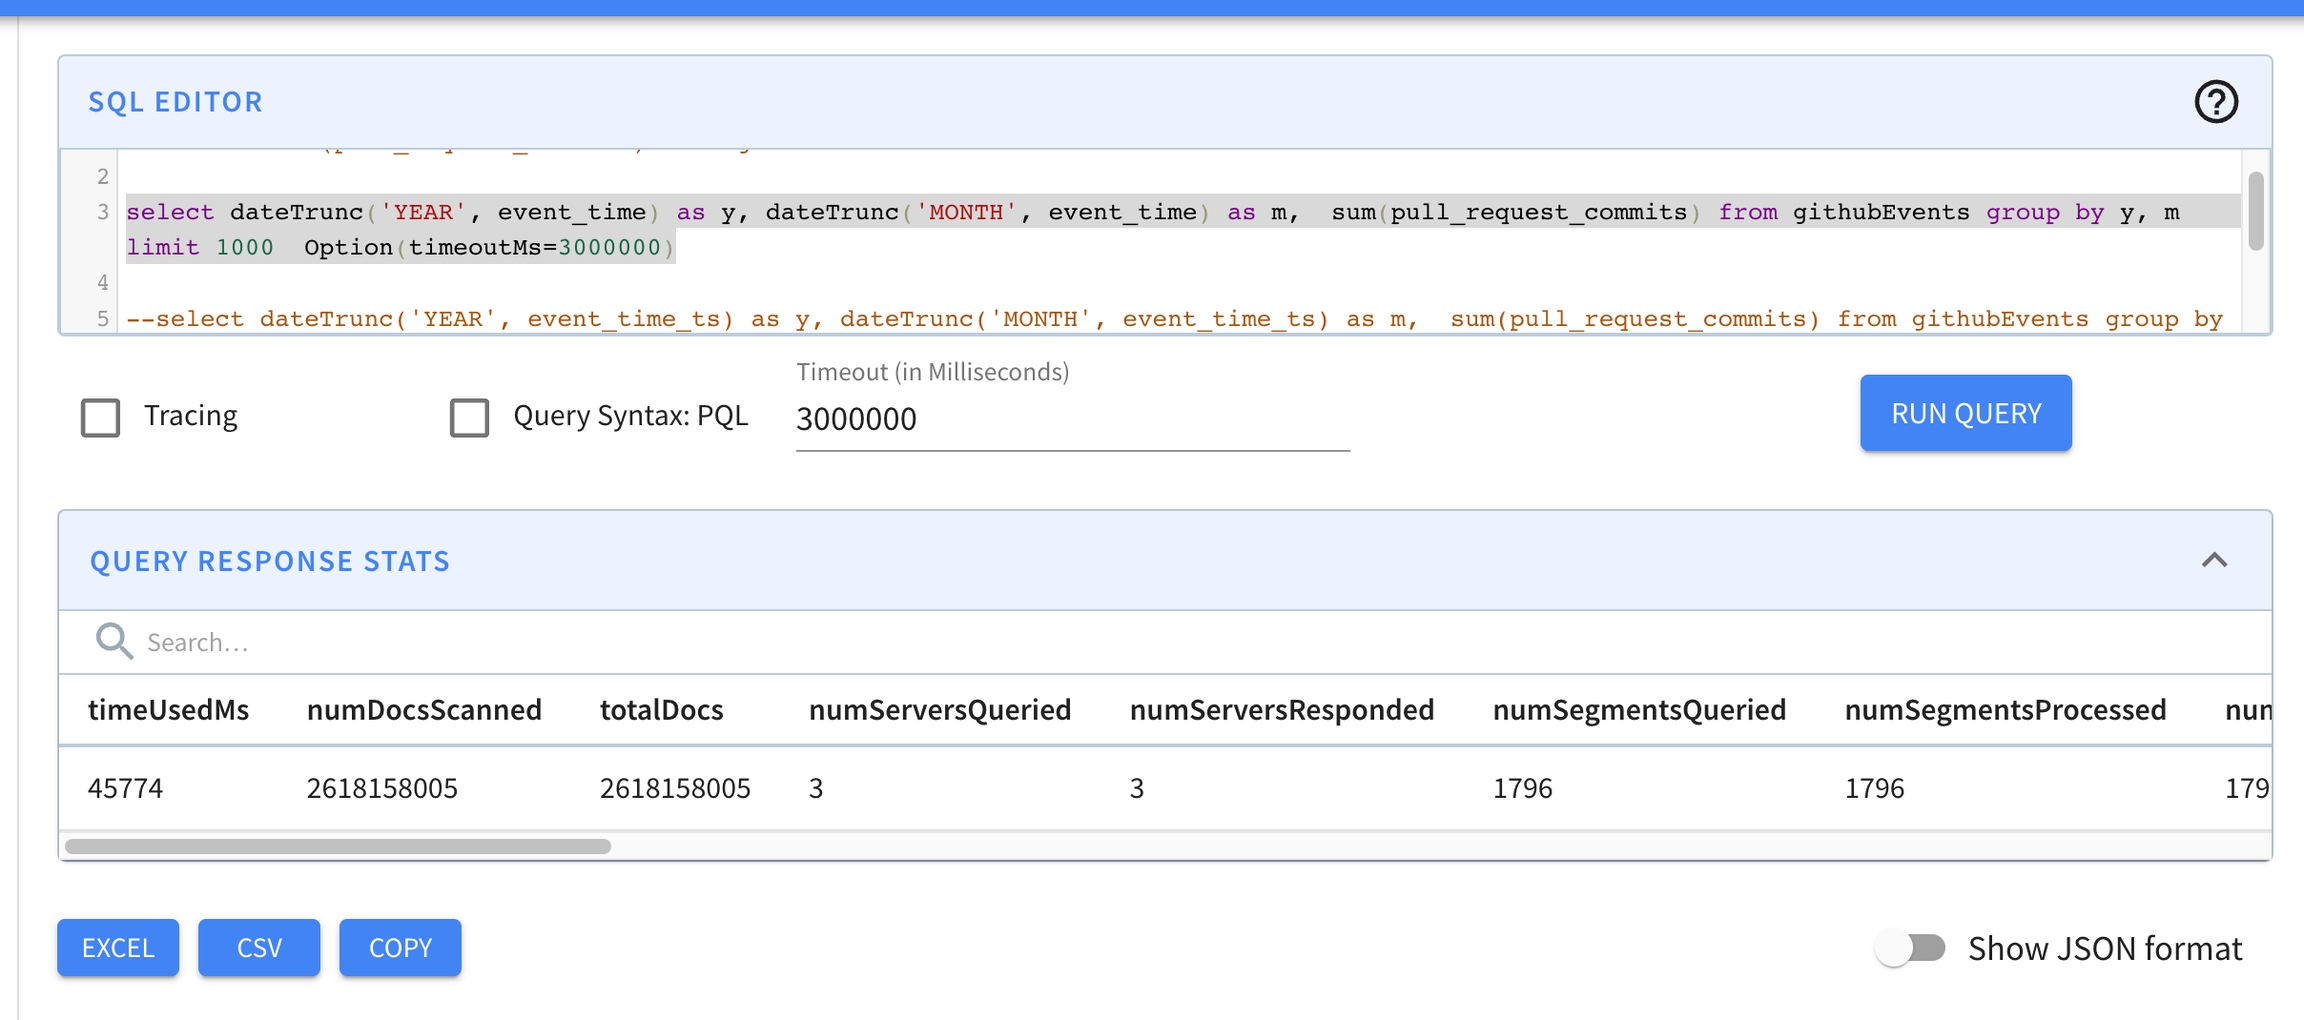
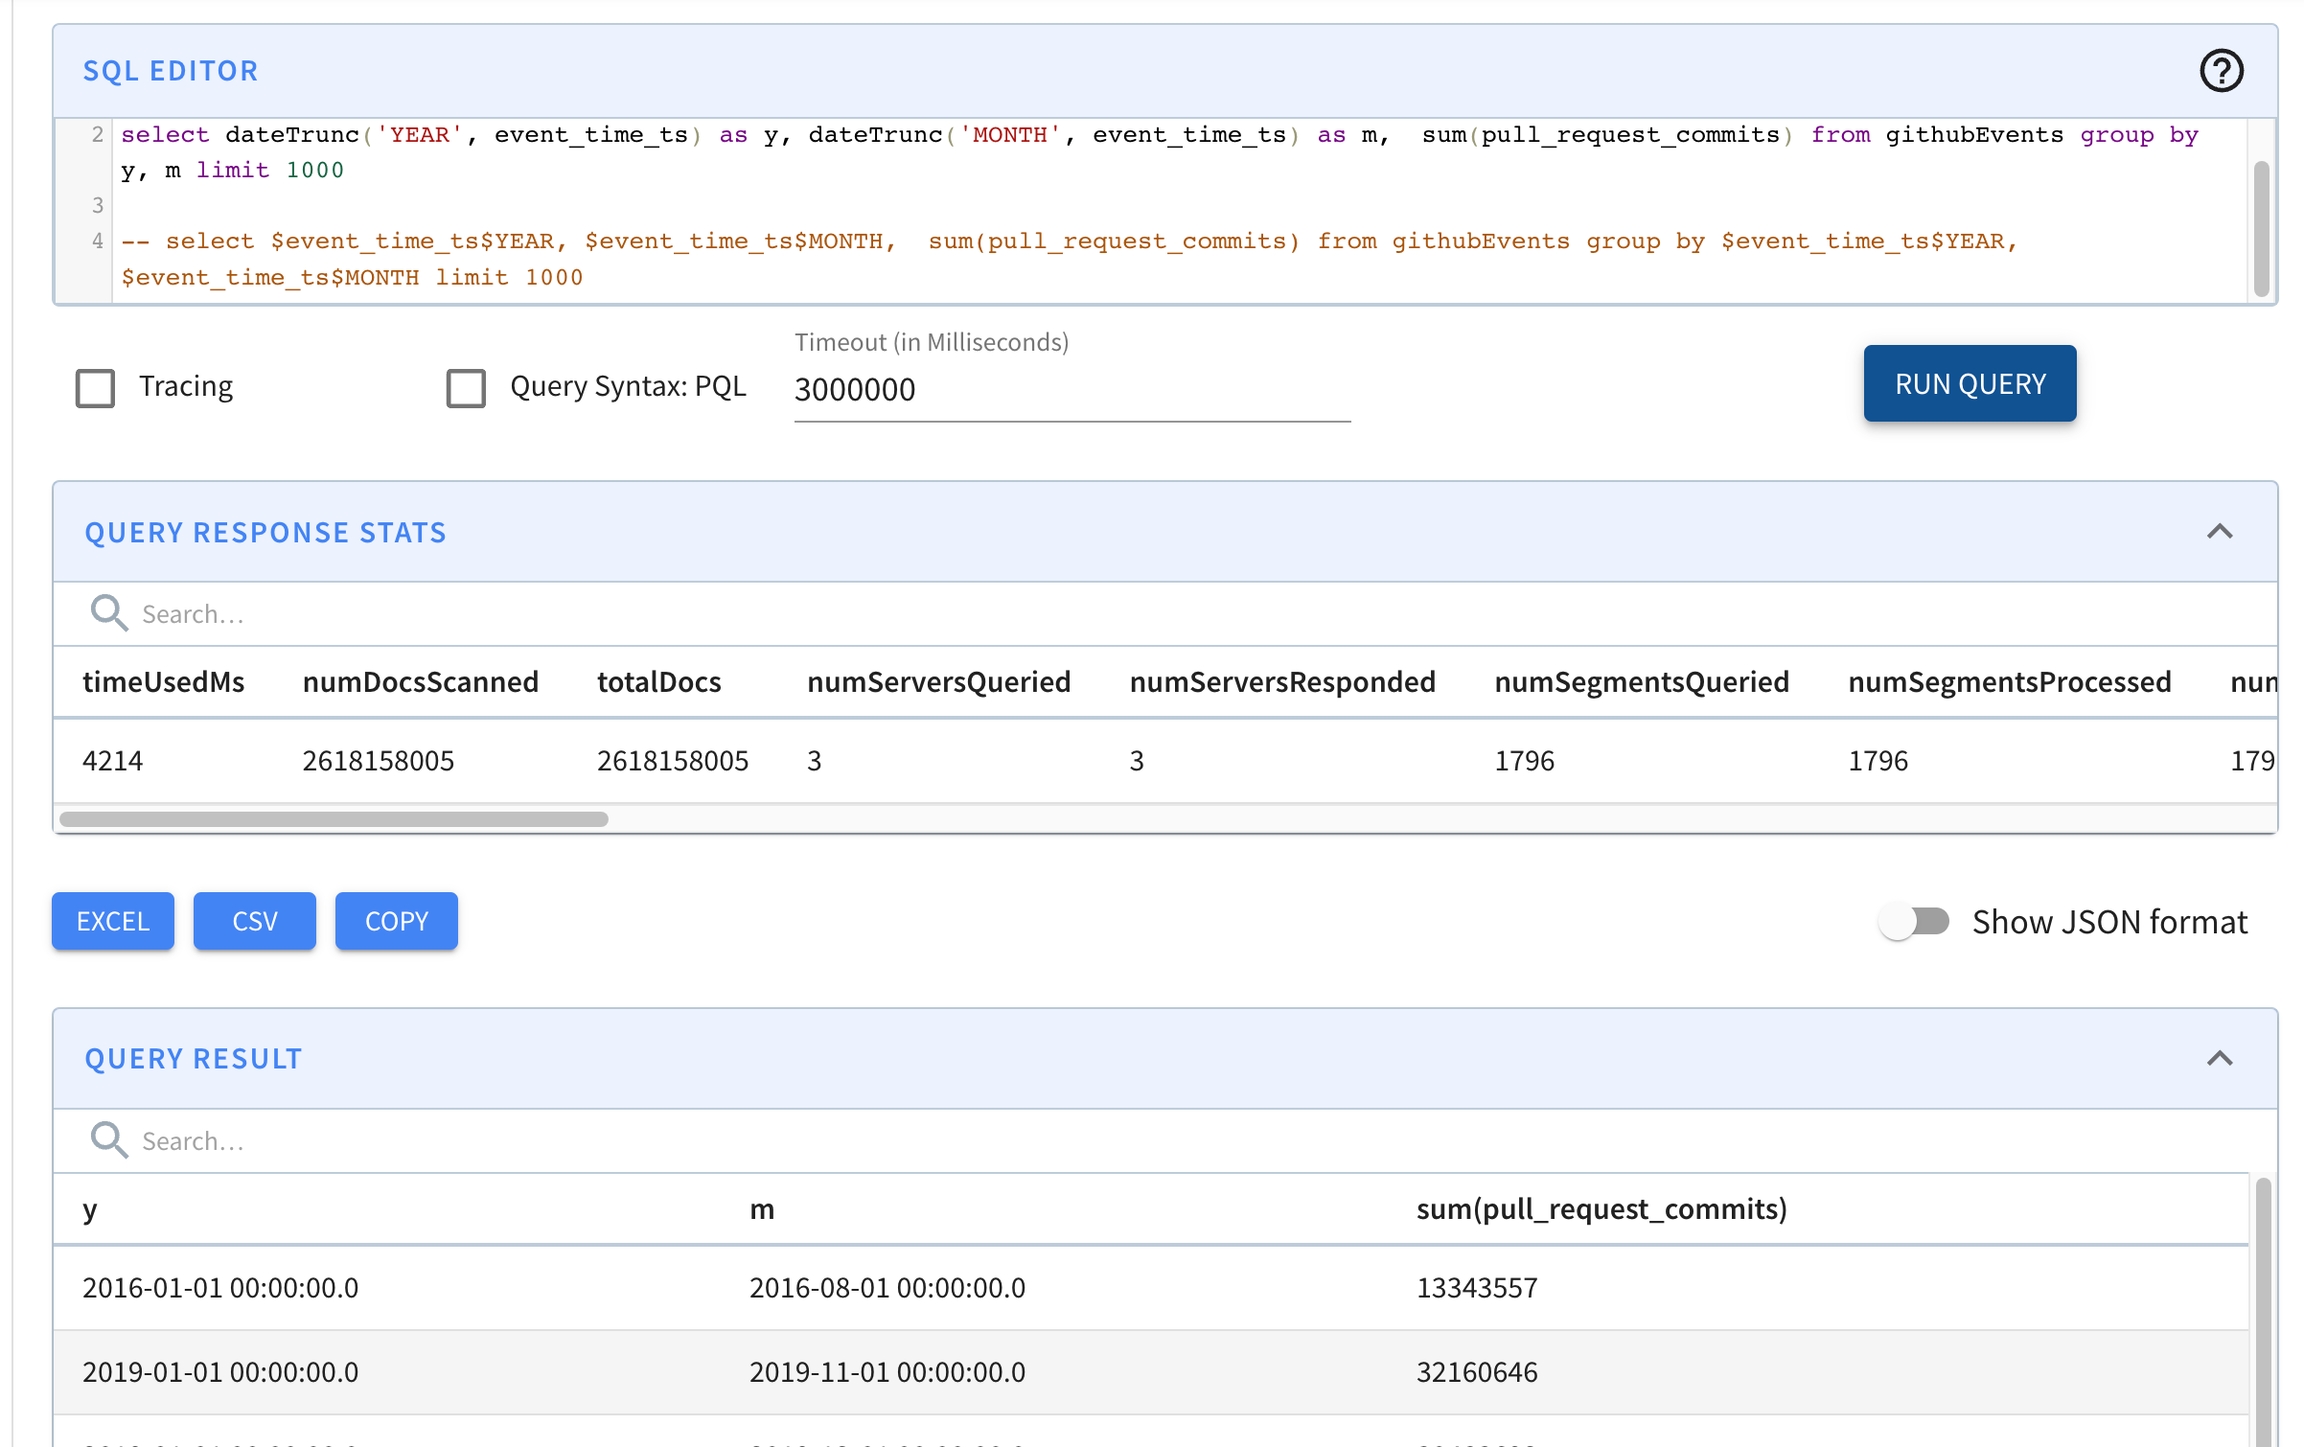
Some preliminary benchmark shows the query perf over 2.7 billion records improved from 45 secs to 4.2 secs
Without Timestamp Index
vs.
With Timestamp Index
Timestamp index is configured per column basis inside the fieldConfigList section in table config.
Users need to specify TIMESTAMP as part of the indexTypes. Then in the field timestampConfig, specify the granularities that you want to index.
select count(*),
datetrunc('WEEK', ts) as tsWeek
from airlineStats
WHERE tsWeek > fromDateTime('2014-01-16', 'yyyy-MM-dd')
group by tsWeek
limit 10
select dateTrunc('YEAR', event_time) as y,
dateTrunc('MONTH', event_time) as m,
sum(pull_request_commits)
from githubEvents
group by y, m
limit 1000
Option(timeoutMs=3000000)
Controller.enable.batch.message.mode to false by default (see PR #3928)
RetentionManager and OfflineSegmentIntervalChecker initial delays configurable (see PR )
Config to control kafka fetcher size and increase default (see PR )
Added a percent threshold to consider startup of services (see PR )
Make SingleConnectionBrokerRequestHandler as default (see PR )
Always enable default column feature, remove the configuration (see PR )
Remove redundant default broker configurations (see PR )
Removed some config keys in server(see PR )
Add config to disable HLC realtime segment (see PR )
Make RetentionManager and OfflineSegmentIntervalChecker initial delays configurable (see PR )
The following config variables are deprecated and will be removed in the next release:
pinot.broker.requestHandlerType will be removed, in favor of using the "singleConnection" broker request handler. If you have set this configuration, please remove it and use the default type ("singleConnection") for broker request handler.
We are in the process of separating Helix and Pinot controllers, so that administrators can have the option of running independent Helix controllers and Pinot controllers.
We are in the process of moving towards supporting SQL query format and results.
We are in the process of separating instance and segment assignment using instance pools to optimize the number of Helix state transitions in Pinot clusters with thousands of tables.
Task management does not work correctly in this release, due to bugs in Helix. We will upgrade to Helix 0.9.2 (or later) version to get this fixed.
You must upgrade to this release before moving onto newer versions of Pinot release. The protocol between Pinot-broker and Pinot-server has been changed and this release has the code to retain compatibility moving forward. Skipping this release may (depending on your environment) cause query errors if brokers are upgraded and servers are in the process of being upgraded.
As always, we recommend that you upgrade controllers first, and then brokers and lastly the servers in order to have zero downtime in production clusters.
Pull Request introduces a backwards incompatible change to Pinot broker. If you use the Java constructor on HelixBrokerStarter class, then you will face a compilation error with this version. You will need to construct the object and call start() method in order to start the broker.
Pull Request introduces a backwards incompatible change for log4j configuration.
If you used a custom log4j configuration (log4j.xml), you need to write a new
log4j2 configuration (log4j2.xml). In addition, you may need to change the
arguments on the command line to start Pinot components.
If you used Pinot-admin command to start Pinot components, you don't need any
change. If you used your own commands to start pinot components, you will
need to pass the new log4j2 config as a jvm parameter (i.e. substitute
-Dlog4j.configuration or -Dlog4j.configurationFile argument with
-Dlog4j2.configurationFile=log4j2.xml).
New Features and Bug Fixes
Work in Progress
Other Notes
Enable the null handling of the query (introduced in 0.11.0)
false (disabled)
explainPlanVerbose
Return verbose result for EXPLAIN query (introduced in 0.11.0)
false (not verbose)
useMultistageEngine
Use multi-stage engine to execute the query (introduced in 0.11.0)
false (use single-stage engine)
maxExecutionThreads
Maximum threads to use to execute the query. Useful to limit the resource usage for expensive queries
Half of the CPU cores for non-group-by queries; all CPU cores for group-by queries
numReplicaGroupsToQuery
When replica-group based routing is enabled, use it to query multiple replica-groups (introduced in 0.11.0)
1 (only query servers within the same replica-group)
minSegmentGroupTrimSize
Minimum groups to keep when trimming groups at the segment level for group-by queries. See
Server level config
minServerGroupTrimSize
Minimum groups to keep when trimming groups at the server level for group-by queries. See
Server level config
skipUpsert
For upsert-enabled table, skip the effect of upsert and query all the records. See
false (exclude the replaced records)
useStarTree
Useful to debug the star-tree index (introduced in 0.11.0)
true (use star-tree if available)
AndScanReordering
disabled
Before release 0.11.0, query options can be appended to the query with the OPTION keyword:
After release 0.11.0, query options can be set using the SET statement:
timeoutMs
Timeout of the query in milliseconds
Use table/broker level timeout
Supported Query Options
enableNullHandling
SELECT * FROM myTable OPTION(key1=value1, key2=123)
SELECT * FROM myTable OPTION(key1=value1) OPTION(key2=123)
SELECT * FROM myTable OPTION(timeoutMs=30000)
SET key1 = 'value1';
SET key2 = 123;
SELECT * FROM myTable
Set Query Options
Before release 0.11.0
After release 0.11.0
select playerName, max(hits)
from baseballStats
group by playerName
order by max(hits) desc
select sum(hits), sum(homeRuns), sum(numberOfGames)
from baseballStats
where yearID > 2010
The Pinot Controller is responsible for the following:
Maintaining global metadata (e.g. configs and schemas) of the system with the help of Zookeeper which is used as the persistent metadata store.
Hosting the Helix Controller and managing other Pinot components (brokers, servers, minions)
Maintaining the mapping of which servers are responsible for which segments. This mapping is used by the servers to download the portion of the segments that they are responsible for. This mapping is also used by the broker to decide which servers to route the queries to.
Serving admin endpoints for viewing, creating, updating, and deleting configs, which are used to manage and operate the cluster.
Serving endpoints for segment uploads, which are used in offline data pushes. They are responsible for initializing real-time consumption and coordination of persisting real-time segments into the segment store periodically.
Undertaking other management activities such as managing retention of segments, validations.
For redundancy, there can be multiple instances of Pinot controllers. Pinot expects that all controllers are configured with the same back-end storage system so that they have a common view of the segments (e.g. NFS). Pinot can use other storage systems such as HDFS or .
The Controller runs several periodic tasks in the background, to perform activities such as management and validation. Each periodic task has its own configs to define the run frequency and default frequency. Each task runs at its own schedule or can also be triggered manually if needed. The task runs on the lead controller for each table.
Here's a list of all the periodic tasks
This task rebuilds the BrokerResource if the instance set has changed.
Config
Default Value
This task periodically cleans up stale Pinot broker/server/minion instances.
Config
Default Value
This task manages the segment ValidationMetrics (missingSegmentCount, offlineSegmentDelayHours, lastPushTimeDelayHours, TotalDocumentCount, NonConsumingPartitionCount, SegmentCount), to ensure that all offline segments are contiguous (no missing segments) and that the offline push delay isn't too high.
Config
Default Value
TBD
This task validates the ideal state and segment zk metadata of realtime tables,
fixing any partitions which have stopped consuming
starting consumption from new partitions
uploading segments to deep store if segment download url is missing
This task ensures that the consumption of the realtime tables gets fixed and keeps going when met with erroneous conditions.
Config
Default Value
This task manages retention of segments for all tables. During the run, it looks at the retentionTimeUnit and retentionTimeValue inside the segmentsConfig of every table, and deletes segments which are older than the retention. The deleted segments are moved to a DeletedSegments folder colocated with the dataDir on segment store, and permanently deleted from that folder in a configurable number of days.
Config
Default Value
This task is applicable only if you have tierConfig or tagOverrideConfig. It runs rebalance in the background to
relocate COMPLETED segments to tag overrides
relocate ONLINE segments to tiers if tier configs are set
At most one replica is allowed to be unavailable during rebalance.
Config
Default Value
This task manages segment status metrics such as realtimeTableCount, offlineTableCount, disableTableCount, numberOfReplicas, percentOfReplicas, percentOfSegments, idealStateZnodeSize, idealStateZnodeByteSize, segmentCount, segmentsInErrorState, tableCompressedSize.
Config
Default Value
TBD
Use the GET /periodictask/names API to fetch the names of all the Periodic Tasks running on your Pinot cluster.
To manually run a named Periodic Task use the GET /periodictask/run API
The Log Request Id (api-09630c07) can be used to search through pinot-controller log file to see log entries related to execution of the Periodic task that was manually run.
If tableName (and its type OFFLINE or REALTIME) is not provided, the task will run against all tables.
Make sure you've . If you're using docker, make sure to . To start a controller
Stream ingestion example
The Docker instructions on this page are still WIP
So far, we setup our cluster, ran some queries on the demo tables and explored the admin endpoints. We also uploaded some sample batch data for transcript table.
Now, it's time to ingest from a sample stream into Pinot. The rest of the instructions assume you're using Pinot in Docker.
Data Stream
First, we need to setup a stream. Pinot has out-of-the-box realtime ingestion support for Kafka. Other streams can be plugged in, more details in Pluggable Streams.
Let's setup a demo Kafka cluster locally, and create a sample topic transcript-topic
Start Kafka cluster on port 9876 using the same Zookeeper from the quick-start examples
Create a Kafka topic
Download the latest . Create a topic
If you followed the , you have already pushed a schema for your sample table. If not, head over to on that page, to learn how to create a schema for your sample data.
If you followed , you learnt how to push an offline table and schema. Similar to the offline table config, we will create a realtime table config for the sample. Here's the realtime table config for the transcript table. For a more detailed overview about table, checkout .
Now that we have our table and schema, let's upload them to the cluster. As soon as the realtime table is created, it will begin ingesting from the Kafka topic.
Here's a JSON file for transcript table data:
Push sample JSON into Kafka topic, using the Kafka script from the Kafka download
As soon as data flows into the stream, the Pinot table will consume it and it will be ready for querying. Head over to the to checkout the realtime data
Amazon S3
You can enable Amazon S3 Filesystem backend by including the plugin pinot-s3 .
By default Pinot loads all the plugins, so you can just drop this plugin there. Also, if you specify -Dplugins.include, you need to put all the plugins you want to use, e.g. pinot-json, pinot-avro , pinot-kafka-2.0...
You can also configure the S3 filesystem using the following options:
Configuration
Description
Each of these properties should be prefixed by pinot.[node].storage.factory.s3. where node is either controller or server depending on the config
e.g.
S3 Filesystem supports authentication using the . The credential provider looks for the credentials in the following order -
Environment Variables - AWS_ACCESS_KEY_ID and AWS_SECRET_ACCESS_KEY (RECOMMENDED since they are recognized by all the AWS SDKs and CLI except for .NET), or AWS_ACCESS_KEY and AWS_SECRET_KEY (only recognized by Java SDK)
Java System Properties - aws.accessKeyId and aws.secretKey
You can also specify the accessKey and secretKey using the properties. However, this method is not secure and should be used only for POC setups.
Hadoop
Segment Creation and Push
Pinot supports Apache Hadoop as a processor to create and push segment files to the database. Pinot distribution is bundled with the Spark code to process your files and convert and upload them to Pinot.
You can follow the [wiki] to build pinot distribution from source. The resulting JAR file can be found in pinot/target/pinot-all-${PINOT_VERSION}-jar-with-dependencies.jar
Next, you need to change the execution config in the job spec to the following -
# executionFrameworkSpec: Defines ingestion jobs to be running.
executionFrameworkSpec:
# name: execution framework name
name: 'hadoop'
# segmentGenerationJobRunnerClassName: class name implements org.apache.pinot.spi.ingestion.batch.runner.IngestionJobRunner interface.
segmentGenerationJobRunnerClassName: 'org.apache.pinot.plugin.ingestion.batch.hadoop.HadoopSegmentGenerationJobRunner'
# segmentTarPushJobRunnerClassName: class name implements org.apache.pinot.spi.ingestion.batch.runner.IngestionJobRunner interface.
segmentTarPushJobRunnerClassName: 'org.apache.pinot.plugin.ingestion.batch.hadoop.HadoopSegmentTarPushJobRunner'
# segmentUriPushJobRunnerClassName: class name implements org.apache.pinot.spi.ingestion.batch.runner.IngestionJobRunner interface.
segmentUriPushJobRunnerClassName: 'org.apache.pinot.plugin.ingestion.batch.hadoop.HadoopSegmentUriPushJobRunner'
# segmentMetadataPushJobRunnerClassName: class name implements org.apache.pinot.spi.ingestion.batch.runner.IngestionJobRunner interface.
segmentMetadataPushJobRunnerClassName: 'org.apache.pinot.plugin.ingestion.batch.hadoop.HadoopSegmentMetadataPushJobRunner'
# extraConfigs: extra configs for execution framework.
extraConfigs:
# stagingDir is used in distributed filesystem to host all the segments then move this directory entirely to output directory.
stagingDir: your/local/dir/staging
You can check out the sample job spec here.
Finally execute the hadoop job using the command -
Please ensure environment variables PINOT_ROOT_DIR and PINOT_VERSION are set properly.
We’ve seen some requests that data should be massaged (like partitioning, sorting, resizing) before creating and pushing segments to Pinot.
The MapReduce job called SegmentPreprocessingJob would be the best fit for this use case, regardless of whether the input data is of AVRO or ORC format.
Check the below example to see how to use SegmentPreprocessingJob.
In Hadoop properties, set the following to enable this job:
In table config, specify the operations in preprocessing.operations that you'd like to enable in the MR job, and then specify the exact configs regarding those operations:
Minimum number of reducers. Optional. Fetched when partitioning gets disabled and resizing is enabled. This parameter is to avoid having too many small input files for Pinot, which leads to the case where Pinot server is holding too many small segments, causing too many threads.
Maximum number of records per reducer. Optional.Unlike, “preprocessing.num.reducers”, this parameter is to avoid having too few large input files for Pinot, which misses the advantage of muti-threading when querying. When not set, each reducer will finally generate one output file. When set (e.g. M), the original output file will be split into multiple files and each new output file contains at most M records. It does not matter whether partitioning is enabled or not.
For more details on this MR job, please refer to this .
Stream Ingestion with CLP
Support for encoding fields with CLP during ingestion.
This is an experimental feature. Configuration options and usage may change frequently until it is stabilized.
When performing stream ingestion of JSON records using Kafka, users can encode specific fields with CLP by using a CLP-specific StreamMessageDecoder.
CLP is a compressor designed to encode unstructured log messages in a way that makes them more compressible while retaining the ability to search them. It does this by decomposing the message into three fields:
the message's static text, called a log type;
repetitive variable values, called dictionary variables; and
non-repetitive variable values (called encoded variables since we encode them specially if possible).
Searches are similarly decomposed into queries on the individual fields.
For example, consider this JSON record:
If the user specifies the fields message and logPath should be encoded with CLP, then the StreamMessageDecoder will output:
In the fields with the _logtype suffix, \x11 is a placeholder for an integer variable, \x12 is a placeholder for a dictionary variable, and \x13 is a placeholder for a float variable. In message_encoedVars, the float variable 0.335 is encoded as an integer using CLP's custom encoding.
All remaining fields are processed in the same way as they are in org.apache.pinot.plugin.inputformat.json.JSONRecordExtractor. Specifically, fields in the table's schema are extracted from each record and any remaining fields are dropped.
Assuming the user wants to encode message and logPath as in the example, they should change/add the following settings to their tableIndexConfig (we omit irrelevant settings for brevity):
stream.kafka.decoder.prop.fieldsForClpEncoding is a comma-separated list of names for fields that should be encoded with CLP.
We use for the logtype and dictionary variables since their length can vary significantly.
Ideally, we would disable the dictionaries for the encoded variable columns (since they are likely to be random), but currently, a bug prevents us from doing that for multi-valued number-type columns.
For the table's schema, users should configure the CLP-encoded fields as follows (we omit irrelevant settings for brevity):
We use the maximum possible length for the logtype and dictionary variable columns.
The dictionary and encoded variable columns are multi-valued columns.
There is currently no built-in support within Pinot for searching and decoding CLP-encoded fields. This will be added in future commits, potentially as a set of UDFs. The development of these features is being tracked in this .
User-Defined Functions (UDFs)
Pinot currently supports two ways for you to implement your own functions:
Groovy Scripts
Scalar Functions
Groovy Scripts
Pinot allows you to run any function using Apache Groovy scripts. The syntax for executing Groovy script within the query is as follows:
GROOVY('result value metadata json', ''groovy script', arg0, arg1, arg2...)
This function will execute the groovy script using the arguments provided and return the result that matches the provided result value metadata. **** The function requires the following arguments:
Result value metadata json - json string representing result value metadata. Must contain non-null keys resultType and isSingleValue.
Groovy script to execute- groovy script string, which uses arg0, arg1
Examples
Add colA and colB and return a single-value INT
groovy( '{"returnType":"INT","isSingleValue":true}', 'arg0 + arg1', colA, colB)\
Find the max element in mvColumn array and return a single-value INT
⚠️ Note that Groovy script doesn't accept Built-In ScalarFunction that's specific to Pinot queries. See the section below for more information.
⚠️Enabling Groovy
Allowing execuatable Groovy in queries can be a security vulnerability. Please use caution and be aware of the security risks if you decide to allow groovy. If you would like to enable Groovy in Pinot queries, you can set the following broker config.
pinot.broker.disable.query.groovy=false
If not set, Groovy in queries is disabled by default.
The above configuration applies across the entire Pinot cluster. If you want a table level override to enable/disable Groovy queries, the following property can be set in the query table config.
Since the 0.5.0 release, Pinot supports custom functions that return a single output for multiple inputs. Examples of scalar functions can be found in and
Pinot automatically identifies and registers all the functions that have the @ScalarFunction annotation.
Only Java methods are supported.
You can add new scalar functions as follows:
Create a new java project. Make sure you keep the package name as org.apache.pinot.scalar.XXXX
In your java project include the dependency
Annotate your methods with @ScalarFunction annotation. Make sure the method is static and returns only a single value output. The input and output can have one of the following types -
Integer
Place the compiled JAR in the /plugins directory in pinot. You will need to restart all Pinot instances if they are already running.
Now, you can use the function in a query as follows:
⚠️ Note that the function name in SQL is the same as the function name in Java. The SQL function name is case-insensitive as well.
Grouping Algorithm
In this guide we will learn about the heuristics used for trimming results in Pinot's grouping algorithm (used when processing GROUP BY queries) to make sure that the server doesn't run out of memory.
Within segment
When grouping rows within a segment, Pinot keeps a maximum of <numGroupsLimit> groups per segment. This value is set to 100,000 by default and can be configured by the pinot.server.query.executor.num.groups.limit property.
If the number of groups of a segment reaches this value, the extra groups will be ignored and the results returned may not be completely accurate. The numGroupsLimitReached property will be set to true in the query response if the value is reached.
Trimming tail groups
After the inner segment groups have been computed, the Pinot query engine optionally trims tail groups. Tail groups are ones that have a lower rank based on the ORDER BY clause used in the query.
This configuration is disabled by default, but can be enabled by configuring the pinot.server.query.executor.min.segment.group.trim.size property.
When segment group trim is enabled, the query engine will trim the tail groups and keep max(<minSegmentGroupTrimSize>, 5 * LIMIT) groups if it gets more groups. Pinot keeps at least 5 * LIMIT groups when trimming tail groups to ensure the accuracy of results.
This value can be overridden on a query by query basis by passing the following option:
Once grouping has been done within a segment, Pinot will merge segment results and trim tail groups and keep max(<minServerGroupTrimSize>, 5 * LIMIT) groups if it gets more groups.
<minServerGroupTrimSize> is set to 5,000 by default and can be adjusted by configuring the pinot.server.query.executor.min.server.group.trim.size property. When setting the configuration to -1, the cross segments trim can be disabled.
This value can be overridden on a query by query basis by passing the following option:
When cross segments trim is enabled, the server will trim the tail groups before sending the results back to the broker. It will also trim the tail groups when the number of groups reaches the <trimThreshold>.
This configuration is set to 1,000,000 by default and can be adjusted by configuring the pinot.server.query.executor.groupby.trim.threshold property.
A higher threshold reduces the amount of trimming done, but consumes more heap memory. If the threshold is set to more than 1,000,000,000, the server will only trim the groups once before returning the results to the broker.
Pinot sets a default LIMIT of 10 if one isn't defined and this applies to GROUP BY queries as well. Therefore, if no limit is specified, Pinot will return 10 groups.
Pinot will trim tail groups based on the ORDER BY clause to reduce the memory footprint and improve the query performance. It keeps at least 5 * LIMIT groups so that the results give good enough approximation in most cases. The configurable min trim size can be used to increase the groups kept to improve the accuracy but has a larger extra memory footprint.
If the query has a HAVING clause, it is applied on the merged GROUP BY results that already have the tail groups trimmed. If the HAVING clause is the opposite of the ORDER BY order, groups matching the condition might already be trimmed and not returned. e.g.
Increase min trim size to keep more groups in these cases.
Parameter
Default
Query Override
Description
Components
Learn about the different components and logical abstractions
This section is a reference for the definition of major components and logical abstractions used in Pinot.
For a general overview that ties together all of the reference material in this section, see Basic Concepts.
Pinot has the concept of a , which is a logical abstraction to refer to a collection of related data. Pinot has a distributed architecture and scales horizontally. Pinot expects the size of a table to grow infinitely over time. In order to achieve this, the entire data needs to be distributed across multiple nodes.
Pinot achieves this by breaking the data into smaller chunks known as segments (similar to shards/partitions in relational databases). Segments can be seen as time-based partitions.
Thus, a segment is a horizontal shard representing a chunk of table data with some number of rows. The segment stores data for all columns of the table. Each segment packs the data in a columnar fashion, along with the dictionaries and indices for the columns. The segment is laid out in a columnar format so that it can be directly mapped into memory for serving queries.
Columns can be single or multi-valued and the following types are supported: STRING, BOOLEAN, INT, LONG, FLOAT, DOUBLE, TIMESTAMP or BYTES
Spark
Pinot supports Apache spark as a processor to create and push segment files to the database. Pinot distribution is bundled with the Spark code to process your files and convert and upload them to Pinot.
We support both Spark 2.X and 3.X
You can follow the to build pinot distribution from source. The resulting JAR file can be found in pinot/target/pinot-all-${PINOT_VERSION}-jar-with-dependencies.jar
If you do build Pinot from Source, you should consider opting into using the build-shaded-jar jar profile with -Pbuild-shaded-jar. While Pinot does not bundle spark into its jar, it does bundle certain hadoop libraries.
Web Identity Token credentials from the environment or container
Credential profiles file at the default location (~/.aws/credentials) shared by all AWS SDKs and the AWS CLI
Credentials delivered through the Amazon EC2 container service if AWS_CONTAINER_CREDENTIALS_RELATIVE_URI environment variable is set and security manager has permission to access the variable,
Instance profile credentials delivered through the Amazon EC2 metadata service
region
The AWS Data center region in which the bucket is located
accessKey
(Optional) AWS access key required for authentication. This should only be used for testing purposes as we don't store these keys in secret.
secretKey
(Optional) AWS secret key required for authentication. This should only be used for testing purposes as we don't store these keys in secret.
endpoint
(Optional) Override endpoint for s3 client.
disableAcl
If this is set tofalse, bucket owner is granted full access to the objects created by pinot. Default value is true.
serverSideEncryption
(Optional) The server-side encryption algorithm used when storing this object in Amazon S3 (Now supports aws:kms), set to null to disable SSE.
ssekmsKeyId
(Optional, but required when serverSideEncryption=aws:kms) Specifies the AWS KMS key ID to use for object encryption. All GET and PUT requests for an object protected by AWS KMS will fail if not made via SSL or using SigV4.
ssekmsEncryptionContext
(Optional) Specifies the AWS KMS Encryption Context to use for object encryption. The value of this header is a base64-encoded UTF-8 string holding JSON with the encryption context key-value pairs.
pinot.server.query.executor.groupby.trim.threshold
The number of groups to trigger the server level trim.
1,000,000
N/A
pinot.server.query.executor.max.execution.threads
The maximum number of execution threads (parallelism of segment processing) used per query.
-1 (use all execution threads)
OPTION(maxExecutionThreads=<maxExecutionThreads>)
pinot.server.query.executor.num.groups.limit
The maximum number of groups allowed per segment.
100,000
N/A
Cross segments
GROUP BY behavior
HAVING behavior
Configuration Parameters
pinot.server.query.executor.min.segment.group.trim.size
The minimum number of groups to keep when trimming groups at the segment level.
. Only single-valued
BIG_DECIMAL
data type is supported.
Columns may be declared to be metric or dimension (or specifically as a time dimension) in the schema. Columns can have default null values. For example, the default null value of a integer column can be 0. The default value for bytes columns must be hex-encoded before it's added to the schema.
Pinot uses dictionary encoding to store values as a dictionary ID. Columns may be configured to be “no-dictionary” column in which case raw values are stored. Dictionary IDs are encoded using minimum number of bits for efficient storage (e.g. a column with a cardinality of 3 will use only 2 bits for each dictionary ID).
A forward index is built for each column and compressed for efficient memory use. In addition, you can optionally configure inverted indices for any set of columns. Inverted indices take up more storage, but improve query performance. Specialized indexes like Star-Tree index are also supported. For more details, see Indexing.
Once the table is configured, we can load some data. Loading data involves generating pinot segments from raw data and pushing them to the pinot cluster. Data can be loaded in batch mode or streaming mode. For more details, see the ingestion overview page.
Below are instructions to generate and push segments to Pinot via standalone scripts. For a production setup, you should use frameworks such as Hadoop or Spark. For more details on setting up data ingestion jobs, see Import Data.
To generate a segment, we need to first create a job spec YAML file. This file contains all the information regarding data format, input data location, and pinot cluster coordinates. Note that this assumes that the controller is RUNNING to fetch the table config and schema. If not, you will have to configure the spec to point at their location. For full configurations, see Ingestion Job Spec.
To create and push the segment in one go, use
Sample Console Output
Alternately, you can separately create and then push, by changing the jobType to SegmentCreation or SegmenTarPush.
The Ingestion job spec supports templating with Groovy Syntax.
This is convenient if you want to generate one ingestion job template file and schedule it on a daily basis with extra parameters updated daily.
e.g. you could set inputDirURI with parameters to indicate the date, so that the ingestion job only processes the data for a particular date. Below is an example that templates the date for input and output directories.
You can pass in arguments containing values for ${year}, ${month}, ${day} when kicking off the ingestion job: -values $param=value1 $param2=value2...
This ingestion job only generates segments for date 2014-01-03
Below is an example of how to publish sample data to your stream. As soon as data is available to the realtime stream, it starts getting consumed by the realtime servers
Run below command to stream JSON data into Kafka topic: flights-realtime
Run below command to stream JSON data into Kafka topic: flights-realtime
Next, you need to change the execution config in the job spec to the following -
You can check out the sample job spec here.
To run Spark ingestion, you need the following jars in your classpath
pinot-batch-ingestion-spark plugin jar - available in plugins-external directory in the package
pinot-all jar - available in lib directory in the package
These jars can be specified using spark.driver.extraClassPath or any other option.
For loading any other plugins that you want to use, you can use -
The complete spark-submit command should look as follows
Please ensure environment variables PINOT_ROOT_DIR and PINOT_VERSION are set properly.
Note: You should change the master to yarn and deploy-mode to cluster for production environments.
If you want to run the spark job in cluster mode on YARN/EMR cluster, the following needs to be done -
Build Pinot from source with option -DuseProvidedHadoop
Copy Pinot binaries to S3, HDFS or any other distributed storage that is accessible from all nodes.
Copy Ingestion spec YAML file to S3, HDFS or any other distributed storage. Mention this path as part of --files argument in the command
Add --jars options that contain the s3/hdfs paths to all the required plugin and pinot-all jar
Point classPath to spark working directory. Generally, just specifying the jar names without any paths works. Same should be done for main jar as well as the spec YAML file
Example
Q - I am getting the following exception - Class has been compiled by a more recent version of the Java Runtime (class file version 55.0), this version of the Java Runtime only recognizes class file versions up to 52.0
Since 0.8.0 release, Pinot binaries are compiled with JDK 11. If you are using Spark along with Hadoop 2.7+, you need to use the java8 version of pinot. Currently, you need to build jdk 8 version from source.
Q - I am not able to find pinot-batch-ingestion-spark jar.
For Pinot version prior to 0.10.0, the spark plugin is located in plugin dir of binary distribution. For 0.10.0 and later, it is located in pinot-external dir.
Q - Spark is not able to find the jarsleading tojava.nio.file.NoSuchFileException
This means the classpath for spark job has not been configured properly. If you are running spark in a distributed environment such as Yarn or k8s, make sure both spark.driver.classpath and spark.executor.classpath are set. Also, the jars in driver.classpath should be added to --jars argument in spark-submit so that spark can distribute those jars to all the nodes in your cluster. You also need to take provide appropriate scheme with the file path when running the jar. In this doc, we have used local:\\ but it can be different dependening on your cluster setup.
Q - Spark job failing while pushing the segments.
It can be because of misconfigured controllerURI in job spec yaml file. If the controllerURI is correct, make sure it is accessible from all the nodes of your YARN or k8s cluster.
If already set to APPEND, this is likely due to a missing timeColumnName in your table config. If you can't provide a time column, please use our segment name generation configs in ingestion spec. Generally using inputFile segment name generator should fix your issue.
Q - I am getting java.lang.RuntimeException: java.io.IOException: Failed to create directory: pinot-plugins-dir-0/plugins/*
Removing -Dplugins.dir=${PINOT_DISTRIBUTION_DIR}/plugins from spark.driver.extraJavaOptions should fix this. As long as plugins are mentioned in classpath and jars argument it should not be an issue.
Q - Getting Class not found: exception
Please check if extraClassPath arguments contain all the plugin jars for both driver and executors. Also, all the plugin jars are mentioned in the --jars argument. If both of these are correct, please check if the extraClassPath contains local filesystem classpaths and not s3 or hdfs or any other distributed file system classpaths.
# executionFrameworkSpec: Defines ingestion jobs to be running.
executionFrameworkSpec:
# name: execution framework name
name: 'spark'
# segmentGenerationJobRunnerClassName: class name implements org.apache.pinot.spi.ingestion.batch.runner.IngestionJobRunner interface.
segmentGenerationJobRunnerClassName: 'org.apache.pinot.plugin.ingestion.batch.spark.SparkSegmentGenerationJobRunner'
# segmentTarPushJobRunnerClassName: class name implements org.apache.pinot.spi.ingestion.batch.runner.IngestionJobRunner interface.
segmentTarPushJobRunnerClassName: 'org.apache.pinot.plugin.ingestion.batch.spark.SparkSegmentTarPushJobRunner'
# segmentUriPushJobRunnerClassName: class name implements org.apache.pinot.spi.ingestion.batch.runner.IngestionJobRunner interface.
segmentUriPushJobRunnerClassName: 'org.apache.pinot.plugin.ingestion.batch.spark.SparkSegmentUriPushJobRunner'
#segmentMetadataPushJobRunnerClassName: class name implements org.apache.pinot.spi.ingestion.batch.runner.IngestionJobRunner interface
segmentMetadataPushJobRunnerClassName: 'org.apache.pinot.plugin.ingestion.batch.spark.SparkSegmentMetadataPushJobRunner'
# extraConfigs: extra configs for execution framework.
extraConfigs:
# stagingDir is used in distributed filesystem to host all the segments then move this directory entirely to output directory.
stagingDir: your/local/dir/staging
We have stopped including spark-core dependency in our jars post 0.10.0 release. Users can try 0.11.0-SNAPSHOT and later versions of pinot-batch-ingestion-spark in case of any runtime issues. You can either or download latest master build jars.
Running in Cluster Mode on YARN
For Spark 3.x, replace pinot-batch-ingestion-spark-2.4 with pinot-batch-ingestion-spark-3.2 in all places in the commands.
Also, ensure the classpath in ingestion spec is changed from org.apache.pinot.plugin.ingestion.batch.spark.
to
org.apache.pinot.plugin.ingestion.batch.spark3.
Each table in Pinot is associated with a Schema. A schema defines what fields are present in the table along with the data types.
The schema is stored in the Zookeeper, along with the table configuration.
Categories
A schema also defines what category a column belongs to. Columns in a Pinot table can be categorized into three categories:
Category
Description
Pinot does not enforce strict rules on which of these categories columns belong to, rather the categories can be thought of as hints to Pinot to do internal optimizations.
For example, metrics may be stored without a dictionary and can have a different default null value.
The categories are also relevant when doing segment merge and rollups. Pinot uses the dimension and time fields to identify records against which to apply merge/rollups.
Metrics aggregation is another example where Pinot uses dimensions and time are used as the key, and automatically aggregates values for the metric columns.
Data types determine the operations that can be performed on a column. Pinot supports the following data types:
Data Type
Default Dimension Value
Default Metric Value
Pinot also supports columns that contain lists or arrays of items, but there isn't an explicit data type to represent these lists or arrays. Instead, you can indicate that a dimension column accepts multiple values. For more information, see in the Schema configuration reference.
Since Pinot doesn't have a dedicated DATETIME datatype support, you need to input time in either STRING, LONG, or INT format. However, Pinot needs to convert the date into an understandable format such as epoch timestamp to do operations. You can refer to for more details on supported formats.
There are several built-in virtual columns inside the schema the can be used for debugging purposes:
Column Name
Column Type
Data Type
Description
These virtual columns can be used in queries in a similar way to regular columns.
First, Make sure your and running.
Let's create a schema and put it in a JSON file. For this example, we have created a schema for flight data.
Then, we can upload the sample schema provided above using either a Bash command or REST API call.
Check out the schema in the to make sure it was successfully uploaded
Running Pinot locally
This quick start guide will help you bootstrap a Pinot standalone instance on your local machine.
In this guide, you'll learn how to download and install Apache Pinot as a standalone instance.
Download Apache Pinot
First, let's download the Pinot distribution for this tutorial. You can either download a packaged release or build a distribution from the source code.
Prerequisites
Install JDK11 or higher (JDK16 is not yet supported)
For JDK 8 support use Pinot 0.7.1 or compile from the source code.
You can build from source or download the distribution:
Download the latest binary release from Apache Pinot, or use this command
PINOT_VERSION=0.12.0#set to the Pinot version you decide to use
Once you have the tar file:
# untar it
tar -zxvf apache-pinot-$PINOT_VERSION-bin.tar.gz
# navigate to directory containing the launcher scripts
cd apache-pinot-$PINOT_VERSION-bin
You can find older versions of Apache Pinot at . For example, if you wanted to download Pinot 0.10.0, you could run the following command:
Follow these steps to checkout code from and build Pinot locally
Currently Apache Pinot doesn't provide official binaries for M1 Mac. You can however build from source using the steps provided above. In addition to the steps, you will need to add the following in your ~/.m2/settings.xml prior to the build.
Also make sure to install rosetta
softwareupdate --install-rosetta
Note that some installations of the JDK do not contain the JNI bindings that are necessary to run all tests, if you see any java.lang.UnsatisfiedLinkError while running tests, you may need to change your JDK. If using Homebrew, you may install AdoptOpenJDK 11 using: brew install --cask adoptopenjdk11
Now that we've downloaded Pinot, it's time to set up a cluster. There are two ways to do this:
Pinot comes with quick-start commands that launch instances of Pinot components in the same process and import pre-built datasets.
For example, the following quick-start launches Pinot with a baseball dataset pre-loaded:
For a list of all the available quick starts, see the .
If you want to play with bigger datasets (more than a few MB), you can launch all the components individually.
The video below is a step-by-step walk through for launching the individual components of Pinot and scaling them to multiple instances.
You can find the commands that are shown in this video in the GitHub repository.
You can use to browse the Zookeeper instance.
Once your cluster is up and running, you can head over to to learn how to run queries against the data.
Starting a pinot component of interest in IntelliJ using debug mode can be useful for development purposes. You can set break points and inspect variables. Take debugging server for example, one can start zookeeper , controller, and broker using the steps in . Then use the following configuration put under $PROJECT_DIR$\.run ) to start server. This is an example of how it can be used. Please replace the metrics-core version and cluster name as needed.
Running Pinot in Docker
This guide will show you to run a Pinot Cluster using Docker.
In this guide we will learn about running Pinot in Docker.
This guide assumes that you have installed Docker and have configured it with enough memory. A sample config is shown below:
Sample Docker resources
The latest Pinot Docker image is published at apachepinot/pinot:latest and you can see a list of all published tags on Docker Hub.
You can pull the Docker image onto your machine by running the following command:
docker pull apachepinot/pinot:latest
Or if you want to use a specific version:
docker pull apachepinot/pinot:0.12.0
Now that we've downloaded the Pinot Docker image, it's time to set up a cluster. There are two ways to do this:
Pinot comes with quick-start commands that launch instances of Pinot components in the same process and import pre-built datasets.
For example, the following quick-start launches Pinot with a baseball dataset pre-loaded:
For a list of all the available quick starts, see the .
The quick start scripts launch Pinot with minimal resources. If you want to play with bigger datasets (more than a few MB), you can launch each of the Pinot components individually.
Create an isolated bridge network in docker
Start Zookeeper in daemon mode. This is a single node zookeeper setup. Zookeeper is the central metadata store for Pinot and should be set up with replication for production use. For more information, see .
Start Pinot Controller in daemon and connect to Zookeeper.
Start Pinot Broker in daemon and connect to Zookeeper.
Start Pinot Server in daemon and connect to Zookeeper.
Optionally, you can also start Kafka for setting up realtime streams. This brings up the Kafka broker on port 9092.
Now all Pinot related components are started as an empty cluster.
You can run the below command to check container status.
Sample Console Output
Create a file called docker-compose.yml that contains the following:
Run the following command to launch all the components:
You can run the below command to check the container status.
Sample Console Output
Once your cluster is up and running, you can head over to to learn how to run queries against the data.
Note: These are sample configs to be used as references. For production setup, you may want to customize it to your needs.
Complex Type (Array, Map) Handling
Complex-type handling in Apache Pinot.
It's common for ingested data to have a complex structure. For example, Avro schemas have records and arrays and JSON supports objects and arrays.
Apache Pinot's data model supports primitive data types (including int, long, float, double, BigDecimal string, bytes), as well as limited multi-value types such as an array of primitive types (multi-valued BigDecimal type is not supported). Such simple data types allow Pinot to build fast indexing structures for good query performance, but it requires some handling of the complex structures.
Support for BIG_DECIMAL type is added after release 0.10.0.
There are in general two options for such handling:
Convert the complex-type data into JSON string and then build a JSON index
Use the inbuilt complex-type handling rules in the ingestion config.
On this page, we'll show how to handle this complex-type structure with these two approaches, to process the example data in the following figure, which is a field group from the .
This object has two child fields and the child group is a nested array with elements of object type.
Apache Pinot provides a powerful to accelerate the value lookup and filtering for the column. To convert an object group with complex type to JSON, you can add the following config to table config.
The config transformConfigs transforms the object group to a JSON string group_json, which then creates the JSON indexing with config jsonIndexColumns. To read the full spec, see .
Also, note that group is a reserved keyword in SQL and therefore needs to be quoted in transformFunction.
Additionally, you need to overwrite the maxLength of the field group_json on the schema, because by default, a string column has a limited length. For example,
For the full spec, see .
With this, you can start to query the nested fields under group. For the details about the supported JSON function, see ).
Though JSON indexing is a handy way to process the complex types, there are some limitations:
It’s not performant to group by or order by a JSON field, because JSON_EXTRACT_SCALAR is needed to extract the values in the GROUP BY and ORDER BY clauses, which invokes the function evaluation.
For cases that you want to use Pinot's such as DISTINCTCOUNTMV
Alternatively, from Pinot 0.8, you can use the complex-type handling in ingestion configurations to flatten and unnest the complex structure and convert them into primitive types. Then you can reduce the complex-type data into a flattened Pinot table, and query it via SQL. With the inbuilt processing rules, you do not need to write ETL jobs in another compute framework such as Flink or Spark.
To process this complex type, you can add the configuration complexTypeConfig to the ingestionConfig. For example:
With the complexTypeConfig , all the map objects will be flattened to direct fields automatically. And with unnestFields , a record with the nested collection will unnest into multiple records. For instance, the example at the beginning will transform into two rows with this configuration example.
Note that
The nested field group_id under group is flattened to group.group_id. The default value of the delimiter is . You can choose another delimiter by specifying the configuration delimiter under complexTypeConfig. This flattening rule also applies to maps in the collections to be unnested.
You can find the full spec of the table config and the table schema .
You can then query the table with primitive values using the following SQL query:
When there are complex structures, it can be challenging and tedious to figure out the Pinot schema manually. To help with schema inference, Pinot provides utility tools to take the Avro schema or JSON data as input and output the inferred Pinot schema.
To infer the Pinot schema from Avro schema, you can use the command like the following:
Note you can input configurations like fieldsToUnnest similar to the ones in complexTypeConfig. And this will simulate the complex-type handling rules on the Avro schema and output the Pinot schema in the file specified in outputDir.
Similarly, you can use the command like the following to infer the Pinot schema from a file of JSON objects.
You can check out an example of this run in this .
Querying Pinot
Learn how to query Pinot using SQL
SQL Interface
Pinot provides SQL interface for querying. It uses the Calcite SQL parser to parse queries and uses MYSQL_ANSI dialect. You can see the grammar in the Calcite documentation.
Limitations
The latest Pinot multi-stage supports inner join, left-outer, semi-join, and nested queries out of the box. It is optimized for in-memory process and latency.
For queries that require a large amount of data shuffling, or require spill-to-disk, or hitting any other limitations of the multi-stage engine, we still recommend using Presto. For more information, see .
The latest Pinot also supports simple DDL to insert data into a table from file directly. For more info please see the .
More DDL supports will be added in the future. But for now, the most common way for data definition is via the .
In Pinot SQL:
Double quotes(") are used to force string identifiers, e.g. column names
Single quotes(') are used to enclose string literals. If the string literal also contains a single quote, escape this with a single quote e.g '''Pinot''' to match the string literal 'Pinot'
Mis-using those might cause unexpected query results:
e.g.
WHERE a='b' means the predicate on the column a equals to a string literal value 'b'
WHERE a="b" means the predicate on the column a equals to the value of the column b
If your column names use reserved keywords (e.g. timestamp or date) or special charactesr, you will need to use double quotes when referring to them in queries.
Note: Defining decimal literals within quotes preserves precision.
For performant filtering of ids in a list, see .
Results might not be consistent if the order by column has the same value in multiple rows.
To count rows where the column airlineName starts with U
Pinot supports the CASE-WHEN-ELSE statement.
Example 1:
Example 2:
Functions have to be implemented within Pinot. Injecting functions is not yet supported. The example below demonstrate the use of UDFs.
For more examples, see .
Pinot supports queries on BYTES column using HEX string. The query response also uses HEX string to represent bytes values.
e.g. the query below fetches all the rows for a given UID.
0.4.0
0.4.0 release introduced the theta-sketch based distinct count function, an S3 filesystem plugin, a unified star-tree index implementation, migration from TimeFieldSpec to DateTimeFieldSpec, etc.
Summary
0.4.0 release introduced various new features, including the theta-sketch based distinct count aggregation function, an S3 filesystem plugin, a unified star-tree index implementation, deprecation of TimeFieldSpec in favor of DateTimeFieldSpec, etc. Miscellaneous refactoring, performance improvement and bug fixes were also included in this release. See details below.
Notable New Features
Made DateTimeFieldSpecs mainstream and deprecated TimeFieldSpec (#2756)
Used time column from table config instead of schema (#5320)
Included dateTimeFieldSpec in schema columns of Pinot Query Console #5392
Used DATE_TIME as the primary time column for Pinot tables (#5399)
Supported range queries using indexes (#5240)
Supported complex aggregation functions
Supported Aggregation functions with multiple arguments (#5261)
Added api in AggregationFunction to get compiled input expressions (#5339)
Added a simple PinotFS benchmark driver (#5160)
Supported default star-tree (#5147)
Added an initial implementation for theta-sketch based distinct count aggregation function (#5316)
One minor side effect: DataSchemaPruner won't work for DistinctCountThetaSketchAggregatinoFunction (#5382)
Added access control for Pinot server segment download api (#5260)
Added Pinot S3 Filesystem Plugin (#5249)
Text search improvement
Pruned stop words for text index (#5297)
Used 8byte offsets in chunk based raw index creator (#5285)
Tooling/usability improvement
Added template support for Pinot Ingestion Job Spec (#5341)
Allowed user to specify zk data dir and don't do clean up during zk shutdown (#5295)
Re-implemented ORCRecordReader (#5267)
Evaluated schema transform expressions during ingestion (#5238)
Handled count distinct query in selection list (#5223)
Enabled async processing in pinot broker query api (#5229)
Supported bootstrap mode for table rebalance (#5224)
Supported order-by on BYTES column (#5213)
Added Nightly publish to binary (#5190)
Shuffled the segments when rebalancing the table to avoid creating hotspot servers (#5197)
Supported inbuilt transform functions (#5312)
Added date time transform functions (#5326)
Deepstore by-pass in LLC: introduced segment uploader (#5277, #5314)
APIs Additions/Changes
Added a new server api for download of segments
/GET /segments/{tableNameWithType}/{segmentName}
Upgraded helix to 0.9.7 (#5411)
Added support to execute functions during query compilation (#5406)
Other notable refactoring
Moved table config into pinot-spi (#5194)
Cleaned up integration tests. Standardized the creation of schema, table config and segments (#5385)
Do not release the PinotDataBuffer when closing the index (#5400)
Handled a no-arg function in query parsing and expression tree (#5375)
Fixed compatibility issues during rolling upgrade due to unknown json fields (#5376)
Upsert: support overriding data in the real-time table (#4261).
Add pinot upsert features to pinot common (#5175)
Enhancements for theta-sketch, e.g. multiValue aggregation support, complex predicates, performance tuning, etc
TableConfig no longer support de-serialization from json string of nested json string (i.e. no \" inside the json) (#5194)
The following APIs are changed in AggregationFunction (use TransformExpressionTree instead of String as the key of blockValSetMap) (#5371):
Explain Plan
Query execution within Pinot is modeled as a sequence of operators that are executed in a pipelined manner to produce the final result. The output of the EXPLAIN PLAN statement can be used to see how queries are being run or to further optimize queries.
Introduction
EXPLAN PLAN can be run in two modes: verbose and non-verbose (default) via the use of a query option. To enable verbose mode the query option explainPlanVerbose=true must be passed.
In the non-verbose EXPLAIN PLAN output above, the Operator column describes the operator that Pinot will run where as, the Operator_Id and Parent_Id columns show the parent-child relationship between operators.
This parent-child relationship shows the order in which operators execute. For example, FILTER_MATCH_ENTIRE_SEGMENT will execute before and pass its output to PROJECT. Similarly, PROJECT will execute before and pass its output to TRANSFORM_PASSTHROUGH operator and so on.
Although the EXPLAIN PLAN query produces tabular output, in this document, we show a tree representation of the EXPLAIN PLAN output so that parent-child relationship between operators are easy to see and user can visualize the bottom-up flow of data in the operator tree execution.
Note a special node with the Operator_Id and Parent_Id called PLAN_START(numSegmentsForThisPlan:1). This node indicates the number of segments which match a given plan. The EXPLAIN PLAN query can be run with the verbose mode enabled using the query option explainPlanVerbose=true which will show the varying deduplicated query plans across all segments across all servers.
EXPLAIN PLAN output should only be used for informational purposes because it is likely to change from version to version as Pinot is further developed and enhanced. Pinot uses a "Scatter Gather" approach to query evaluation (see for more details). At the Broker, an incoming query is split into several server-level queries for each backend server to evaluate. At each Server, the query is further split into segment-level queries that are evaluated against each segment on the server. The results of segment queries are combined and sent to the Broker. The Broker in turn combines the results from all the Servers and sends the final results back to the user. Note that if the EXPLAIN PLAN query runs without the verbose mode enabled, a single plan will be returned (the heuristic used is to return the deepest plan tree) and this may not be an accurate representation of all plans across all segments. Different segments may execute the plan in a slightly different way.
Reading the EXPLAIN PLAN output from bottom to top will show how data flows from a table to query results. In the example shown above, the FILTER_MATCH_ENTIRE_SEGMENT operator shows that all 977889 records of the segment matched the query. The DOC_ID_SET over the filter operator gets the set of document IDs matching the filter operator. The PROJECT operator over the DOC_ID_SET operator pulls only those columns that were referenced in the query. The TRANSFORM_PASSTHROUGH operator just passes the column data from PROJECT operator to the SELECT operator. At SELECT, the query has been successfully evaluated against one segment. Results from different data segments are then combined (COMBINE_SELECT) and sent to the Broker. The Broker combines and reduces the results from different servers (
The rest of this document illustrates the EXPLAIN PLAN output with examples and describe the operators that show up in the output of the EXPLAIN PLAN.
Since verbose mode is enabled, the EXPLAIN PLAN output returns two plans matching one segment each (assuming 2 segments for this table). The first EXPLAIN PLAN output above shows that Pinot used an inverted index to evaluate the predicate "playerID = 'aardsda01'" (FILTER_INVERTED_INDEX). The result was then fully scanned (FILTER_FULL_SCAN) to evaluate the second predicate "playerName = 'David Allan'". Note that the two predicates are being combined using AND in the query; hence, only the data that satsified the first predicate needs to be scanned for evaluating the second predicate. However, if the predicates were being combined using OR, the query would run very slowly because the entire "playerName" column would need to be scanned from top to bottom to look for values satisfying the second predicate. To improve query efficiency in such cases, one should consider indexing the "playerName" column as well. The second plan output shows a FILTER_EMPTY indicating that no matching documents were found for one segment.
The EXPLAIN PLAN output above shows how GROUP BY queries are evaluated in Pinot. GROUP BY results are created on the server (AGGREGATE_GROUPBY_ORDERBY) for each segment on the server. The server then combines segment-level GROUP BY results (COMBINE_GROUPBY_ORDERBY) and sends the combined result to the Broker. The Broker combines GROUP BY result from all the servers to produce the final result which is send to the user. Note that the COMBINE_SELECT operator from the previous query was not used here, instead a different COMBINE_GROUPBY_ORDERBY operator was used. Depending upon the type of query different combine operators such as COMBINE_DISTINCT and COMBINE_ORDERBY etc may be seen.
The root operator of the EXPLAIN PLAN output is BROKER_REDUCE. BROKER_REDUCE indicates that Broker is processing and combining server results into final result that is sent back to the user. BROKER_REDUCE has a COMBINE operator as its child. Combine operator combines the results of query evaluation from each segment on the server and sends the combined result to the Broker. There are several combine operators (COMBINE_GROUPBY_ORDERBY, COMBINE_DISTINCT, COMBINE_AGGREGATE, etc.) that run depending upon the operations being performed by the query. Under the Combine operator, either a Select (SELECT, SELECT_ORDERBY, etc.) or an Aggregate (AGGREGATE, AGGREGATE_GROUPBY_ORDERBY
Filtering with IdSet
Learn how to write fast queries for looking up ids in a list of values.
A common use case is filtering on an id field with a list of values. This can be done with the IN clause, but this approach doesn't perform well with large lists of ids. In these cases, you can use an IdSet.
This function returns a base 64 encoded IdSet of the values for a single column. The IdSet implementation used depends on the column data type:
INT - RoaringBitmap unless sizeThresholdInBytes is exceeded, in which case Bloom Filter.
LONG - Roaring64NavigableMap unless sizeThresholdInBytes is exceeded, in which case Bloom Filter.
Other types - Bloom Filter
The following parameters are used to configure the Bloom Filter:
expectedInsertions - Number of expected insertions for the BloomFilter, must be positive
fpp - Desired false positive probability for the BloomFilter, must be positive and < 1.0
Note that when a Bloom Filter is used, the filter results are approximate - you can get false-positive results (for membership in the set), leading to potentially unexpected results.
IN_ID_SET(columnName, base64EncodedIdSet)
This function returns 1 if a column contains a value specified in the IdSet and 0 if it does not.
IN_SUBQUERY(columnName, subQuery)
This function generates an IdSet from a subquery and then filters ids based on that IdSet on a Pinot broker.
IN_PARTITIONED_SUBQUERY(columnName, subQuery)
This function generates an IdSet from a subquery and then filters ids based on that IdSet on a Pinot server.
This function works best when the data is partitioned by the id column and each server contains all the data for a partition. The generated IdSet for the subquery will be smaller as it will only contain the ids for the partitions served by the server. This will give better performance.
You can create an IdSet of the values in the yearID column by running the following:
idset(yearID)
When creating an IdSet for values in non INT/LONG columns, we can configure the expectedInsertions:
idset(playerName)
idset(playerName)
We can also configure the fpp parameter:
idset(playerName)
We can use the IN_ID_SET function to filter a query based on an IdSet. To return rows for yearIDs in the IdSet, run the following:
To return rows for yearIDs not in the IdSet, run the following:
To filter rows for yearIDs in the IdSet on a Pinot Broker, run the following query:
To filter rows for yearIDs not in the IdSet on a Pinot Broker, run the following query:
To filter rows for yearIDs in the IdSet on a Pinot Server, run the following query:
To filter rows for yearIDs not in the IdSet on a Pinot Server, run the following query:
Ingestion FAQ
While Pinot can work with segments of various sizes, for optimal use of Pinot, you want to get your segments sized in the 100MB to 500MB (un-tarred/uncompressed) range. Please note that having too many (thousands or more) of tiny segments for a single table just creates more overhead in terms of the metadata storage in Zookeeper as well as in the Pinot servers' heap. At the same time, having too few really large (GBs) segments reduces parallelism of query execution, as on the server side, the thread parallelism of query execution is at segment level.
Yes. Each table can be independently configured to consume from any given Kafka topic, regardless of whether there are other tables that are also consuming from the same Kafka topic.
Pinot automatically detects new partitions in Kafka topics. It checks for new partitions whenever RealtimeSegmentValidationManager periodic job runs and starts consumers for new partitions.
You can configure the interval for this job using thecontroller.realtime.segment.validation.frequencyPeriod property in controller configuration.
0.5.0
This release includes many new features on Pinot ingestion and connectors, query capability and a revamped controller UI.
This release includes many new features on Pinot ingestion and connectors (e.g., support for filtering during ingestion which is configurable in table config; support for json during ingestion; proto buf input format support and a new Pinot JDBC client), query capability (e.g., a new GROOVY transform function UDF) and admin functions (a revamped Cluster Manager UI & Query Console UI). It also contains many key bug fixes. See details below.
The release was cut from the following commit:
and the following cherry-picks:
Derived num docs per chunk from max column value length for varbyte raw index creator (#5256)
Added inter segment tests for text search and fixed a bug for Lucene query parser creation (#5226)
Made text index query cache a configurable option (#5176)
Added Lucene DocId to PinotDocId cache to improve performance (#5177)
Removed the construction of second bitmap in text index reader to improve performance (#5199)
Allowed configuring minion task timeout in the PinotTaskGenerator (#5317)
Update JVM settings for scripts (#5127)
Added Stream github events demo (#5189)
Moved docs link from gitbook to docs.pinot.apache.org (#5193)
Added jsonExtractScalar function to extract field from json object (#4597)
Added template support for Pinot Ingestion Job Spec #5372
Cleaned up AggregationFunctionContext (#5364)
Optimized real-time range predicate when cardinality is high (#5331)
Made PinotOutputFormat use table config and schema to create segments (#5350)
Tracked unavailable segments in InstanceSelector (#5337)
Added a new best effort segment uploader with bounded upload time (#5314)
In SegmentPurger, used table config to generate the segment (#5325)
Decoupled schema from RecordReader and StreamMessageDecoder (#5309)
Implemented ARRAYLENGTH UDF for multi-valued columns (#5301)
Improved GroupBy query performance (#5291)
Optimized ExpressionFilterOperator (#5132)
Fixed missing error message from pinot-admin command (#5305)
Fixed HDFS copy logic (#5218)
Fixed spark ingestion issue (#5216)
Fixed the capacity of the DistinctTable (#5204)
Fixed various links in the Pinot website
Major Bug Fixes
Work in Progress
Backward Incompatible Changes
BROKER_REDUCE
) into a final result that is sent to the user. The
PLAN_START(numSegmentsForThisPlan:1)
indicates that a single segment matched this query plan. If verbose mode is enabled many plans can be returned and each will contain a node indicating the number of matched segments.
, etc.) can appear. Aggreate operator is present when query performs aggregation (
count(*)
,
min
,
max
, etc.); otherwise, a Select operator is present. If the query performs scalar transformations (Addition, Multiplication, Concat, etc.), then one would see TRANSFORM operator appear under the SELECT operator. Often a
TRANSFORM_PASSTHROUGH
operator is present instead of the TRANSFORM operator.
TRANSFORM_PASSTHROUGH
just passes results from operators that appear lower in the operator execution heirarchy to the SELECT operator.
DOC_ID_SET
operator usually appear above FILTER operators and indicate that a list of matching document IDs are assessed. FILTER operators usually appear at the bottom of the operator heirarchy and show index use. For example, the presence of FILTER_FULL_SCAN indicates that index was not used (and hence the query is likely to run relatively slow). However, if the query used an index one of the indexed filter operators (
FILTER_SORTED_INDEX
,
FILTER_RANGE_INDEX
,
FILTER_INVERTED_INDEX
,
FILTER_JSON_INDEX
, etc.) will show up.
EXPLAIN PLAN using verbose mode for a query that evaluates filters with and without index
The query passed to IN_SUBQUERY and IN__PARTITIONED__SUBQUERY can be run on any table - they aren't restricted to the table used in the parent query.
Examples
Create IdSet
Filter by values in IdSet
Filter by values not in IdSet
Filter on broker
Filter on server
//default to limit 10
SELECT *
FROM myTable
SELECT *
FROM myTable
LIMIT 100
SELECT "date", "timestamp"
FROM myTable
SELECT COUNT(*), MAX(foo), SUM(bar)
FROM myTable
SELECT MIN(foo), MAX(foo), SUM(foo), AVG(foo), bar, baz
FROM myTable
GROUP BY bar, baz
LIMIT 50
SELECT MIN(foo), MAX(foo), SUM(foo), AVG(foo), bar, baz
FROM myTable
GROUP BY bar, baz
ORDER BY bar, MAX(foo) DESC
LIMIT 50
SELECT COUNT(*)
FROM myTable
WHERE foo = 'foo'
AND bar BETWEEN 1 AND 20
OR (baz < 42 AND quux IN ('hello', 'goodbye') AND quuux NOT IN (42, 69))
SELECT COUNT(*)
FROM myTable
WHERE foo IS NOT NULL
AND foo = 'foo'
AND bar BETWEEN 1 AND 20
OR (baz < 42 AND quux IN ('hello', 'goodbye') AND quuux NOT IN (42, 69))
SELECT *
FROM myTable
WHERE quux < 5
LIMIT 50
SELECT foo, bar
FROM myTable
WHERE baz > 20
ORDER BY bar DESC
LIMIT 100
SELECT foo, bar
FROM myTable
WHERE baz > 20
ORDER BY bar DESC
LIMIT 50, 100
SELECT COUNT(*)
FROM myTable
WHERE REGEXP_LIKE(airlineName, '^U.*')
GROUP BY airlineName LIMIT 10
SELECT
CASE
WHEN price > 30 THEN 3
WHEN price > 20 THEN 2
WHEN price > 10 THEN 1
ELSE 0
END AS price_category
FROM myTable
SELECT
SUM(
CASE
WHEN price > 30 THEN 30
WHEN price > 20 THEN 20
WHEN price > 10 THEN 10
ELSE 0
END) AS total_cost
FROM myTable
SELECT COUNT(*)
FROM myTable
GROUP BY DATETIMECONVERT(timeColumnName, '1:MILLISECONDS:EPOCH', '1:HOURS:EPOCH', '1:HOURS')
SELECT *
FROM myTable
WHERE UID = 'c8b3bce0b378fc5ce8067fc271a34892'
EXPLAIN PLAN FOR
SELECT playerID, count(*)
FROM baseballStats
WHERE playerID != 'aardsda01'
GROUP BY playerID
BROKER_REDUCE(limit:10)
└── COMBINE_GROUPBY_ORDERBY
└── PLAN_START(numSegmentsForThisPlan:1)
└── AGGREGATE_GROUPBY_ORDERBY(groupKeys:playerID, aggregations:count(*))
└── TRANORM_PASSTHROUGH(playerID)
└── PROJECT(playerID)
└── DOC_ID_SET
└── FILTER_INVERTED_INDEX(indexLookUp:inverted_index,operator:NOT_EQ,predicate:playerID != 'aardsda01')
SELECT ID_SET(yearID)
FROM baseballStats
WHERE teamID = 'WS1'
SELECT ID_SET(playerName, 'expectedInsertions=10')
FROM baseballStats
WHERE teamID = 'WS1'
SELECT ID_SET(playerName, 'expectedInsertions=100')
FROM baseballStats
WHERE teamID = 'WS1'
SELECT ID_SET(playerName, 'expectedInsertions=100;fpp=0.01')
FROM baseballStats
WHERE teamID = 'WS1'
SELECT yearID, count(*)
FROM baseballStats
WHERE IN_ID_SET(
yearID,
'ATowAAABAAAAAAA7ABAAAABtB24HbwdwB3EHcgdzB3QHdQd2B3cHeAd5B3oHewd8B30Hfgd/B4AHgQeCB4MHhAeFB4YHhweIB4kHigeLB4wHjQeOB48HkAeRB5IHkweUB5UHlgeXB5gHmQeaB5sHnAedB54HnwegB6EHogejB6QHpQemB6cHqAc='
) = 1
GROUP BY yearID
SELECT yearID, count(*)
FROM baseballStats
WHERE IN_ID_SET(
yearID,
'ATowAAABAAAAAAA7ABAAAABtB24HbwdwB3EHcgdzB3QHdQd2B3cHeAd5B3oHewd8B30Hfgd/B4AHgQeCB4MHhAeFB4YHhweIB4kHigeLB4wHjQeOB48HkAeRB5IHkweUB5UHlgeXB5gHmQeaB5sHnAedB54HnwegB6EHogejB6QHpQemB6cHqAc='
) = 0
GROUP BY yearID
SELECT yearID, count(*)
FROM baseballStats
WHERE IN_SUBQUERY(
yearID,
'SELECT ID_SET(yearID) FROM baseballStats WHERE teamID = ''WS1'''
) = 1
GROUP BY yearID
SELECT yearID, count(*)
FROM baseballStats
WHERE IN_SUBQUERY(
yearID,
'SELECT ID_SET(yearID) FROM baseballStats WHERE teamID = ''WS1'''
) = 0
GROUP BY yearID
SELECT yearID, count(*)
FROM baseballStats
WHERE IN_PARTITIONED_SUBQUERY(
yearID,
'SELECT ID_SET(yearID) FROM baseballStats WHERE teamID = ''WS1'''
) = 1
GROUP BY yearID
SELECT yearID, count(*)
FROM baseballStats
WHERE IN_PARTITIONED_SUBQUERY(
yearID,
'SELECT ID_SET(yearID) FROM baseballStats WHERE teamID = ''WS1'''
) = 0
GROUP BY yearID
0
FLOAT
0.0
DOUBLE
0.0
BIG_DECIMAL
Not supported
0.0
BOOLEAN
0 (false)
N/A
TIMESTAMP
0 (1970-01-01 00:00:00 UTC)
N/A
STRING
"null"
N/A
JSON
"null"
N/A
BYTES
byte array of length 0
byte array of length 0
Dimension
STRING
Name of the segment containing the record
$docId
Dimension
INT
Document id of the record within the segment
Dimension
Dimension columns are typically used in slice and dice operations for answering business queries. Some operations for which dimension columns are used:
GROUP BY - group by one or more dimension columns along with aggregations on one or more metric columns
Filter clauses such as WHERE
Metric
These columns represent the quantitative data of the table. Such columns are used for aggregation. In data warehouse terminology, these can also be referred to as fact or measure columns.
Some operation for which metric columns are used:
Aggregation - SUM, MIN, MAX, COUNT, AVG etc
Filter clause such as WHERE
DateTime
This column represents time columns in the data. There can be multiple time columns in a table, but only one of them can be treated as primary. The primary time column is the one that is present in the segment config.
The primary time column is used by Pinot to maintain the time boundary between offline and real-time data in a hybrid table and for retention management. A primary time column is mandatory if the table's push type is APPEND and optional if the push type is REFRESH .
Common operations that can be done on time column:
BOOLEAN, TIMESTAMP, JSON are added after release 0.7.1. In release 0.7.1 and older releases, BOOLEAN is equivalent to STRING.BIG_DECIMAL is added after release 0.10.0.
The lowest granularity TIMESTAMP type supports is milliseconds epoch, nanoseconds is not supported.
The nested array group_topics under group is unnested into the top-level, and converts the output to a collection of two rows. Note the handling of the nested field within group_topics, and the eventual top-level field of group.group_topics.urlkey. All the collections to unnest shall be included in the configuration fieldsToUnnest.
Collections not specified in fieldsToUnnestwill be serialized into JSON string, except for the array of primitive values, which will be ingested as a multi-value column by default. The behavior is defined by the collectionNotUnnestedToJson config, which takes the following values:
NON_PRIMITIVE- Converts the array to a multi-value column. (default)
ALL- Converts the array of primitive values to JSON string.
The columnName can't use the same name as any of the fields in the source JSON data e.g. if our source data contains the field group and we want to transform the data in that field before persisting it, the destination column name would need to be something different, like group_json.
Ingestion configurations
. is a reserved character in SQL, so you need to quote the flattened columns in the query.
Infer the Pinot schema from the Avro schema and JSON data
The partitioning logic in the stream should match the partitioning config in Pinot. Kafka uses murmur2, and the equivalent in Pinot is Murmur function.
Set partitioning config as below using same column used in Kafka
and also set
More details about how partitioner works in Pinot here.
For JSON, you can use hex encoded string to ingest BYTES
See the json_format(field) function which can store a top level json field as a STRING in Pinot.
Then you can use these json functions during query time, to extract fields from the json string.
By default, Pinot limits the length of a String column to 512 bytes. If you want to overwrite this value, you can set the maxLength attribute in the schema as follows:
Events are available to queries as soon as they are ingested. This is because events are instantly indexed in memory upon ingestion.
The ingestion of events into the real-time table is not transactional, so replicas of the open segment are not immediately consistent. Pinot trades consistency for availability upon network partitioning (CAP theorem) to provide ultra-low ingestion latencies at high throughput.
However, when the open segment is closed and its in-memory indexes are flushed to persistent storage, all its replicas are guaranteed to be consistent, with the commit protocol.
This typically happens if
The consumer is lagging a lot
The consumer was down (server down, cluster down), and the stream moved on, resulting in offset not found when consumer comes back up.
In case of Kafka, to recover, set property "auto.offset.reset":"earliest" in the streamConfigs section and reset the CONSUMING segment. See Realtime table configs for more details about the config.
You can also also use the "Resume Consumption" endpoint with "resumeFrom" parameter set to "smallest" (or "largest" if you want). Refer to Pause Stream Ingestion for more details.
Inverted indexes are set in the tableConfig's tableIndexConfig -> invertedIndexColumns list. For documentation on table config, see Table Config Reference. For an example showing how to configure an inverted index, see Inverted Index.
Applying inverted indexes to a table config will generate an inverted index for all new segments. To apply the inverted indexes to all existing segments, see How to apply an inverted index to existing segments?
Once you've done that, you can check whether the index has been applied by querying the segment metadata API at http://localhost:9000/help#/Segment/getServerMetadata. Don't forget to include the names of the column on which you have applied the index.
The output from this API should look something like the following:
Not all indexes can be retrospectively applied to existing segments.
The new segments will have star-tree indexes generated after applying the star-tree index configs to the table config. Currently, Pinot does not support adding star-tree indexes to the existing segments.
Pinot does not require ordering of event time stamps. Out of order events are still consumed and indexed into the "currently consuming" segment. In a pathological case, if you have a 2 day old event come in "now", it will still be stored in the segment that is open for consumption "now". There is no strict time-based partitioning for segments, but star-indexes and hybrid tables will handle this as appropriate.
See the Components > Broker for more details about how hybrid tables handle this. Specifically, the time-boundary is computed as max(OfflineTIme) - 1 unit of granularity. Pinot does store the min-max time for each segment and uses it for pruning segments, so segments with multiple time intervals may not be perfectly pruned.
When generating star-indexes, the time column will be part of the star-tree so the tree can still be efficiently queried for segments with multiple time intervals.
This lets you have an old event up come in without building complex offline pipelines that perfectly partition your events by event timestamps. With this offset, even if your offline data pipeline produces segments with a maximum timestamp, Pinot will not use the offline dataset for that last chunk of segments. The expectation is if you process offline the next time-range of data, your data pipeline will include any late events.
It might seem odd that segments are not strictly time-partitioned, unlike similar systems such as Apache Druid. This allows real-time ingestion to consume out-of-order events. Even though segments are not strictly time-partitioned, Pinot will still index, prune, and query segments intelligently by time intervals for the performance of hybrid tables and time-filtered data.
When generating offline segments, the segments generated such that segments only contain one time interval and are well partitioned by the time column.
Data processing
What is a good segment size?
Can multiple Pinot tables consume from the same Kafka topic?
If I add a partition to a Kafka topic, will Pinot automatically ingest data from this partition?
How do I enable partitioning in Pinot, when using Kafka stream?
"tableIndexConfig": {
..
"segmentPartitionConfig": {
"columnPartitionMap": {
"column_foo": {
"functionName": "Murmur",
"numPartitions": 12 // same as number of kafka partitions
}
}
}
NOTE
This works well if some of your fields are nested json, but most of your fields are top level json keys. If all of your fields are within a nested JSON key, you will have to store the entire payload as 1 column, which is not ideal.
Support for flattening during ingestion is on the roadmap:
How do I escape Unicode in my Job Spec YAML file?
Is there a limit on the maximum length of a string column in Pinot?
When can new events become queryable when getting ingested into a real-time table?
How to reset a CONSUMING segment stuck on an offset which has expired from the stream?
Indexing
How to set inverted indexes?
How to apply an inverted index to existing segments?
Can I retrospectively add an index to any segment?
How to create star-tree indexes?
Handling time in Pinot
How does Pinot’s real-time ingestion handle out-of-order events?
What is the purpose of a hybrid table not using max(OfflineTime) to determine the time-boundary, and instead using an offset?
Allowing update on an existing instance config: PUT /instances/{instanceName} with Instance object as the pay-load (#PR4952)
Add PinotServiceManager to start Pinot components (#PR5266)
Support for protocol buffers input format. (#PR5293)
Add GenericTransformFunction wrapper for simple ScalarFunctions () — Adding support to invoke any scalar function via GenericTransformFunction
Add Support for SQL CASE Statement ()
Support distinctCountRawThetaSketch aggregation that returns serialized sketch. ()
Add multi-value support to SegmentDumpTool () — add segment dump tool as part of the pinot-tool.sh script
Add json_format function to convert json object to string during ingestion. () — Can be used to store complex objects as a json string (which can later be queries using jsonExtractScalar)
Support escaping single quote for SQL literal () — This is especially useful for DistinctCountThetaSketch because it stores expression as literal E.g. DistinctCountThetaSketch(..., 'foo=''bar''', ...)
Support expression as the left-hand side for BETWEEN and IN clause ()
Add a new field IngestionConfig in TableConfig — FilterConfig: ingestion level filtering of records, based on filter function. () — TransformConfig: ingestion level column transformations. This was previously introduced in Schema (FieldSpec#transformFunction), and has now been moved to TableConfig. It continues to remain under schema, but we recommend users to set it in the TableConfig starting this release ().
Allow star-tree creation during segment load () — Introduced a new boolean config enableDynamicStarTreeCreation in IndexingConfig to enable/disable star-tree creation during segment load.
Support for Pinot clients using JDBC connection ()
Support customized accuracy for distinctCountHLL, distinctCountHLLMV functions by adding log2m value as the second parameter in the function. () —Adding cluster config: default.hyperloglog.log2m to allow user set default log2m value.
Add segment encryption on Controller based on table config ()
Add a constraint to the message queue for all instances in Helix, with a large default value of 100000. ()
Support order-by aggregations not present in SELECT () — Example: "select subject from transcript group by subject order by count() desc" This is equivalent to the following query but the return response should not contain count(). "select subject, count() from transcript group by subject order by count() desc"
Add geo support for Pinot queries () — Added geo-spatial data model and geospatial functions
Cluster Manager UI & Query Console UI revamp ( and ) — updated cluster manage UI and added table details page and segment details page
Add Controller API to explore Zookeeper ()
Support BYTES type for dictinctCount and group-by ( and ) —Add BYTES type support to DistinctCountAggregationFunction —Correctly handle BYTES type in DictionaryBasedAggregationOperator for DistinctCount
Support for ingestion job spec in JSON format ()
Improvements to RealtimeProvisioningHelper command () — Improved docs related to ingestion and plugins
Added GROOVY transform function UDF () — Ability to run a groovy script in the query as a UDF. e.g. string concatenation: SELECT GROOVY('{"returnType": "INT", "isSingleValue": true}', 'arg0 + " " + arg1', columnA, columnB) FROM myTable
Changed the stream and metadata interface (PR#5542) — This PR concludes the work for the issue #5359 to extend offset support for other streams
TransformConfig: ingestion level column transformations. This was previously introduced in Schema (FieldSpec#transformFunction), and has now been moved to TableConfig. It continues to remain under schema, but we recommend users to set it in the TableConfig starting this release (PR#5681).
Config key enable.case.insensitive.pql in Helix cluster config is deprecated, and replaced with enable.case.insensitive. (#PR5546)
Change default segment load mode to MMAP. () —The load mode for segments currently defaults to heap.
Fix bug in distinctCountRawHLL on SQL path (#5494)
Fix backward incompatibility for existing stream implementations (#5549)
Fix backward incompatibility in StreamFactoryConsumerProvider (#5557)
Fix logic in isLiteralOnlyExpression. ()
Fix double memory allocation during operator setup ()
Allow segment download url in Zookeeper to be deep store uri instead of hardcoded controller uri ()
Fix a backward compatible issue of converting BrokerRequest to QueryContext when querying from Presto segment splits ()
Fix the issue that PinotSegmentToAvroConverter does not handle BYTES data type. ()
PQL queries with HAVING clause will no longer be accepted for the following reasons: (#PR5570) — HAVING clause does not apply to PQL GROUP-BY semantic where each aggregation column is ordered individually — The current behavior can produce inaccurate results without any notice — HAVING support will be added for SQL queries in the next release
Because of the standardization of the DistinctCountThetaSketch predicate strings, please upgrade Broker before Server. The new Broker can handle both standard and non-standard predicate strings for backward-compatibility. (#PR5613)
CONTAINER ID IMAGE COMMAND CREATED STATUS PORTS NAMES
ba5cb0868350 apachepinot/pinot:0.9.3 "./bin/pinot-admin.s…" About a minute ago Up About a minute 8096-8099/tcp, 9000/tcp pinot-server
698f160852f9 apachepinot/pinot:0.9.3 "./bin/pinot-admin.s…" About a minute ago Up About a minute 8096-8098/tcp, 9000/tcp, 0.0.0.0:8099->8099/tcp, :::8099->8099/tcp pinot-broker
b1ba8cf60d69 apachepinot/pinot:0.9.3 "./bin/pinot-admin.s…" About a minute ago Up About a minute 8096-8099/tcp, 0.0.0.0:9000->9000/tcp, :::9000->9000/tcp pinot-controller
54e7e114cd53 zookeeper:3.5.6 "/docker-entrypoint.…" About a minute ago Up About a minute 2888/tcp, 3888/tcp, 0.0.0.0:2181->2181/tcp, :::2181->2181/tcp, 8080/tcp pinot-zookeeper
Quick Start
Manual Cluster
Docker
Create a Network
Start Zookeeper
Start Pinot Controller
The command below expects a 4GB memory container. Tune-Xms and-Xmx if your machine doesn't have enough resources.
Start Pinot Broker
The command below expects a 4GB memory container. Tune-Xms and-Xmx if your machine doesn't have enough resources.
Start Pinot Server
The command below expects a 16GB memory container. Tune-Xms and-Xmx if your machine doesn't have enough resources.
This section describes quick start commands that launch all Pinot components in a single process.
Pinot ships with QuickStart commands that launch Pinot components in a single process and import pre-built datasets. These QuickStarts are a good place if you're just getting started with Pinot.
Prerequisites
You will need to have or .
macOS Monterey Users
By default the Airplay receiver server runs on port 7000, which is also the port used by the Pinot Server in the Quick Start. You may see the following error when running these examples:
If you disable the Airplay receiver server and try again, you shouldn't see this error message anymore.
Batch
This example demonstrates how to do batch processing with Pinot. The command:
Starts Apache Zookeeper, Pinot Controller, Pinot Broker, and Pinot Server.
Creates the baseballStats table
Launches a standalone data ingestion job that builds one segment for a given CSV data file for the baseballStats table and pushes the segment to the Pinot Controller.
Issues sample queries to Pinot
This example demonstrates how to import and query JSON documents in Pinot. The command:
Starts Apache Zookeeper, Pinot Controller, Pinot Broker, and Pinot Server.
Creates the githubEvents table
Launches a standalone data ingestion job that builds one segment for a given JSON data file for the githubEvents table and pushes the segment to the Pinot Controller.
This example demonstrates how to do batch processing in Pinot where the the data items have complex fields that need to be unnested. The command:
Starts Apache Zookeeper, Pinot Controller, Pinot Broker, and Pinot Server.
Creates the githubEvents table
Launches a standalone data ingestion job that builds one segment for a given JSON data file for the githubEvents table and pushes the segment to the Pinot Controller.
This example demonstrates how to do stream processing with Pinot. The command:
This example demonstrates how to do stream processing in Pinot with RealtimeToOfflineSegmentsTask and MergeRollupTask minion tasks continuously optimizing segments as data gets ingested. The command:
This example demonstrates how to do stream processing in Pinot where the stream contains items that have complex fields that need to be unnested. The command:
Launches a standalone data ingestion job that builds segments under a given directory of Avro files for the airlineStats table and pushes the segments to the Pinot Controller.
This example demonstrates how to do joins in Pinot using the . The command:
Starts Apache Zookeeper, Pinot Controller, Pinot Broker, and Pinot Server in the same container.
Creates the baseballStats table
Launches a data ingestion job that builds one segment for a given CSV data file for the baseballStats table and pushes the segment to the Pinot Controller.
Operations FAQ
Memory
How much heap should I allocate for my Pinot instances?
Typically, Pinot components try to use as much off-heap (MMAP/DirectMemory) wherever possible. For example, Pinot servers load segments in memory-mapped files in MMAP mode (recommended), or direct memory in HEAP mode. Heap memory is used mostly for query execution and storing some metadata. We have seen production deployments with high throughput and low-latency work well with just 16 GB of heap for Pinot servers and brokers. Pinot controller may also cache some metadata (table configs etc) in heap, so if there are just a few tables in the Pinot cluster, a few GB of heap should suffice.
DR
Does Pinot provide any backup/restore mechanism?
Pinot relies on deep-storage for storing backup copy of segments (offline as well as realtime). It relies on Zookeeper to store metadata (table configs, schema, cluster state, etc). It does not explicitly provide tools to take backups or restore these data, but relies on the deep-storage (ADLS/S3/GCP/etc), and ZK to persist these data/metadata.
Alter Table
Can I change a column name in my table, without losing data?
Changing a column name or data type is considered backward incompatible change. While Pinot does support schema evolution for backward compatible changes, it does not support backward incompatible changes like changing name/data-type of a column.
How to change number of replicas of a table?
You can change the number of replicas by updating the table config's segmentsConfig section. Make sure you have at least as many servers as the replication.
For OFFLINE table, update
For REALTIME table update
After changing the replication, run a .
Refer to .
Likely explanation: num partitions * num replicas < num servers
In realtime tables, segments of the same partition always continue to remain on the same node. This sticky assignment is needed for replica groups and is critical if using upserts. For instance, if you have 3 partitions, 1 replica, and 4 nodes, only ¾ nodes will be used, and all of p0 segments will be on 1 node, p1 on 1 node, and p2 on 1 node. One server will be unused, and will remain unused through rebalances.
There’s nothing we can do about CONSUMING segments, they will continue to use only 3 nodes if you have 3 partitions. But we can rebalance such that completed segments use all nodes. If you want to force the completed segments of the table to use the new server, use this config
The number of segments generated depends on the number of input files. If you provide only 1 input file, you will get 1 segment. If you break up the input file into multiple files, you will get as many segments as the input files.
This typically happens when the server is unable to load the segment. Possible causes: Out-Of-Memory, no-disk space, unable to download segment from deep-store, and similar other errors. Please check server logs for more information.
Use the segment reset controller REST API to reset the segment:
Refer to .
RESET: this gets a segment in ERROR state back to ONLINE or CONSUMING state. Behind the scenes, Pinot controller takes the segment to OFFLINE state, waits for External View to stabilize, and then moves it back to ONLINE/CONSUMING state, thus effectively resetting segments or consumers in error states.
REFRESH: this replaces the segment with a new one, with the same name but often different data. Under the hood, Pinot controller sets new segment metadata in Zookeeper, and notifies brokers and servers to check their local states about this segment and update accordingly. Servers also download the new segment to replace the old one, when both have different checksums. There is no separate rest API for refreshing, and it is done as part of SegmentUpload API today.
RELOAD: this reloads the segment, often to generate a new index as updated in table config. Underlying, Pinot server gets the new table config from Zookeeper, and uses it to guide the segment reloading. In fact, the last step of REFRESH as explained above is to load the segment into memory to serve queries. There is a dedicated rest API for reloading. By default, it doesn't download segment. But option is provided to force server to download segment to replace the local one cleanly.
In addition, RESET brings the segment OFFLINE temporarily; while REFRESH and RELOAD swap the segment on server atomically without bringing down the segment or affecting ongoing queries.
Set this property in your controller.conf file
Now your brokers and servers should join the cluster as broker_untagged and server_untagged . You can then directly use the POST /tenants API to create the desired tenants
There are two task configs but set as part of cluster configs like below. One controls task's overall timeout (1hr by default) and one for how many tasks to run on a single minion worker (1 by default). The <taskType> is the task to tune, e.g. MergeRollupTask or RealtimeToOfflineSegmentsTask etc.
Refer to
Yes, replica groups work for realtime. There's 2 parts to enabling replica groups:
Replica groups segment assignment
Replica group query routing
Replica group segment assignment
Replica group segment assignment is achieved in realtime, if number of servers is a multiple of number of replicas. The partitions get uniformly sprayed across the servers, creating replica groups.
For example, consider we have 6 partitions, 2 replicas, and 4 servers.
r1
r2
As you can see, the set (S0, S2) contains r1 of every partition, and (s1, S3) contains r2 of every partition. The query will only be routed to one of the sets, and not span every server.
If you are are adding/removing servers from an existing table setup, you have to run for segment assignment changes to take effect.
Replica group query routing
Once replica group segment assignment is in effect, the query routing can take advantage of it. For replica group based query routing, set the following in the table config's section, and then restart brokers
Wait for the pause status to success
Update the credential in the table config
Geospatial
This page talks about geospatial support in Pinot.
Geospatial data types, such as point, line and polygon;
Geospatial functions, for querying of spatial properties and relationships.
Geospatial indexing, used for efficient processing of spatial operations
Geospatial data types abstract and encapsulate spatial structures such as boundary and dimension. In many respects, spatial data types can be understood simply as shapes. Pinot supports the Well-Known Text (WKT) and Well-Known Binary (WKB) form of geospatial objects, for example:
It is common to have data in which the coordinates are geographics or latitude/longitude. Unlike coordinates in Mercator or UTM, geographic coordinates are not Cartesian coordinates.
Geographic coordinates do not represent a linear distance from an origin as plotted on a plane. Rather, these spherical coordinates describe angular coordinates on a globe.
Spherical coordinates specify a point by the angle of rotation from a reference meridian (longitude), and the angle from the equator (latitude).
You can treat geographic coordinates as approximate Cartesian coordinates and continue to do spatial calculations. However, measurements of distance, length and area will be nonsensical. Since spherical coordinates measure angular distance, the units are in degrees.
Pinot supports both geometry and geography types, which can be constructed by the corresponding functions as shown in . And for the geography types, the measurement functions such as ST_Distance and ST_Area calculate the spherical distance and area on earth respectively.
For manipulating geospatial data, Pinot provides a set of functions for analyzing geometric components, determining spatial relationships, and manipulating geometries. In particular, geospatial functions that begin with the ST_ prefix support the SQL/MM specification.
Following geospatial functions are available out of the box in Pinot-
This aggregate function returns a MULTI geometry or NON-MULTI geometry from a set of geometries. it ignores NULL geometries.
Returns a geometry type object from WKT representation, with the optional spatial system reference.
Returns a geometry type object from WKB representation.
Returns a geometry type point object with the given coordinate values.
ST_Area(Geometry/Geography g) → double For geometry type, it returns the 2D Euclidean area of a geometry. For geography, returns the area of a polygon or multi-polygon in square meters using a spherical model for Earth.
For geometry type, returns the 2-dimensional cartesian minimum distance (based on spatial ref) between two geometries in projected units. For geography, returns the great-circle distance in meters between two SphericalGeography points. Note that g1, g2 shall have the same type.
Returns the type of the geometry as a string. e.g.:
Returns the WKB representation of the geometry.
Returns the WKT representation of the geometry/geography.
Converts a Geometry object to a spherical geography object.
Converts a spherical geographical object to a Geometry object.
Returns true if and only if no points of the second geometry/geography lie in the exterior of the first geometry/geography, and at least one point of the interior of the first geometry lies in the interior of the second geometry. Warning: ST_Contains on Geography only give close approximation
ST_Equals(Geometry, Geometry) → boolean Returns true if the given geometries represent the same geometry/geography.
ST_Within(Geometry, Geometry) → boolean Returns true if first geometry is completely inside second geometry.
Geospatial functions are typically expensive to evaluate, and using geoindex can greatly accelerate the query evaluation. Geoindexing in Pinot is based on Uber’s , a hexagon-based hierarchical gridding.
A given geospatial location (longitude, latitude) can map to one hexagon (represented as H3Index). And its neighbors in H3 can be approximated by a ring of hexagons. To quickly identify the distance between any given two geospatial locations, we can convert the two locations in the H3Index, and then check the H3 distance between them. H3 distance is measured as the number of hexagons.
For example, in the diagram below, the red hexagons are within the 1 distance of the central hexagon. The size of the hexagon is determined by the resolution of the indexing. Please check this table for the level of and the corresponding precision (measured in km).
To use the geoindex, first declare the geolocation field as bytes in the schema, as in the example of the .
Note the use of transformFunction that converts the created point into SphericalGeography format, which is needed by the ST_Distance function.
Next, declare the geospatial index in the :
The query below will use the geoindex to filter the Starbucks stores within 5km of the given point in the bay area.
Geoindex in Pinot accelerates the query evaluation without compromising the correctness of the query result. Currently, geoindex supports the ST_Distance function used in the range predicates in the WHERE clause, as shown in the query example in the previous section.
At the high level, geoindex is used for retrieving the records within the nearby hexagons of the given location, and then use ST_Distance to accurately filter the matched results.
As in the example diagram above, if we want to find all relevant points within a given distance at San Francisco (represented in the area within the red circle), then the algorithm with geoindex works as the following:
Find the H3 distance x that contains the range (i.e. red circle)
For the points within the H3 distance (i.e. covered by the hexagons within ), we can directly take those points without filtering
For the points falling into the H3 distance (i.e. in the hexagons of kRing(x)
Publishes data to a Kafka topic meetupRSVPEvents that is subscribed to by Pinot.
Issues sample queries to Pinot
Publishes data to a Kafka topic meetupRSVPEvents that is subscribed to by Pinot
Issues sample queries to Pinot
Publishes data to a Kafka topic githubEvents that is subscribed to by Pinot.
Issues sample queries to Pinot
Publishes data to a Kafka topic meetupRSVPEvents that is subscribed to by Pinot.
Issues sample queries to Pinot
Publishes data to a Kafka topic meetupRSVPEvents that is subscribed to by Pinot
Issues sample queries to Pinot
Publishes data to a Kafka topic meetupRSVPEvents that is subscribed to by Pinot
Issues sample queries to Pinot
Launches a stream of flights stats
Publishes data to a Kafka topic airlineStatsEvents that is subscribed to by Pinot.
Issues sample queries to Pinot
Creates the dimBaseballTeams table
Launches a data ingestion job that builds one segment for a given CSV data file for the dimBaseballStats table and pushes the segment to the Pinot Controller.
Using "POST /cluster/configs" API on CLUSTER tab in Swagger, with this payload
{
"<taskType>.timeoutMs": "600000",
"<taskType>.numConcurrentTasksPerInstance": "4"
}
Failed to start a Pinot [SERVER]
java.lang.RuntimeException: java.net.BindException: Address already in use
at org.apache.pinot.core.transport.QueryServer.start(QueryServer.java:103) ~[pinot-all-0.9.0-jar-with-dependencies.jar:0.9.0-cf8b84e8b0d6ab62374048de586ce7da21132906]
at org.apache.pinot.server.starter.ServerInstance.start(ServerInstance.java:158) ~[pinot-all-0.9.0-jar-with-dependencies.jar:0.9.0-cf8b84e8b0d6ab62374048de586ce7da21132906]
at org.apache.helix.manager.zk.ParticipantManager.handleNewSession(ParticipantManager.java:110) ~[pinot-all-0.9.0-jar-with-dependencies.jar:0.9.0-cf8b84e8b0d6ab62374048de586ce7da2113
A table is a logical abstraction that represents a collection of related data. It is composed of columns and rows (known as documents in Pinot). The columns, data types, and other metadata related to the table are defined using a schema.
Pinot breaks a table into multiple segments and stores these segments in a deep-store such as HDFS as well as Pinot servers.
In the Pinot cluster, a table is modeled as a Helix resource and each segment of a table is modeled as a Helix Partition.
Pinot supports the following types of table:
Type
Description
is used to define the table properties, such as name, type, indexing, routing, retention etc. It is written in JSON format and is stored in Zookeeper, along with the table schema.
You can use the following properties to make your tables faster or leaner:
Segment
Indexing
Tenants
A table is comprised of small chunks of data. These chunks are known as Segments. To learn more about how Pinot creates and manages segments see
For offline tables, Segments are built outside of pinot and uploaded using a distributed executor such as Spark or Hadoop. For more details, see .
For real-time tables, segments are built in a specific interval inside Pinot. You can tune the following for the real-time segments:
The Pinot real-time consumer ingests the data, creates the segment, and then flushes the in-memory segment to disk. Pinot allows you to configure when to flush the segment in the following ways:
Number of consumed rows - After consuming X no. of rows from the stream, Pinot will persist the segment to disk
Number of desired rows per segment - Pinot learns and then estimates the number of rows that need to be consumed so that the persisted segment is approximately the size. The learning phase starts by setting the number of rows to 100,000 (this value can be changed) and adjusts it to reach the desired segment size. The segment size may go significantly over the desired size during the learning phase. Pinot corrects the estimation as it goes along, so it is not guaranteed that the resulting completed segments are of the exact size as configured. You should set this value to optimize the performance of queries.
Replicas
A segment can have multiple replicas to provide higher availability. You can configure the number of replicas for a table segment using
Completion Mode
By default, if the in-memory segment in the is equivalent to the committed segment, then the non-winner server builds and replaces the segment. If the available segment is not equivalent to the committed segment, the server simply downloads the committed segment from the controller.
However, in certain scenarios, the segment build can get very memory intensive. It might be desirable to enforce the non-committer servers to just download the segment from the controller, instead of building it again. You can do this by setting completionMode: "DOWNLOAD" in the table configuration
For more details on why this is needed, see
Download Scheme
A Pinot server may fail to download segments from the deep store such as HDFS after its completion. However, you can configure servers to download these segments from peer servers instead of the deep store. Currently, only HTTP and HTTPS download schemes are supported. More methods such as gRPC/Thrift can be added in the future.
For more details about peer segment download during real-time ingestion, please refer to this design doc on
You can create multiple indices on a table to increase the performance of the queries. The following types of indices are supported:
Dictionary-encoded forward index with bit compression
Raw value forward index
For more details on each indexing mechanism and corresponding configurations, see .
You can also set up on columns to make queries faster. Further, you can also keep segments in off-heap instead of on-heap memory for faster queries.
You can aggregate the real-time stream data as it is consumed to reduce segment sizes. We sum the metric column values of all rows that have the same values for all dimension and time columns and create a single row in the segment. This feature is only available on REALTIME tables.
The only supported aggregation is SUM. The columns on which pre-aggregation is to be done need to satisfy the following requirements:
All metrics should be listed in noDictionaryColumns .
There should not be any multi-value dimensions.
All dimension columns are treated to have a dictionary, even if they appear as noDictionaryColumns in the config.
The following table config snippet shows an example of enabling pre-aggregation during real-time ingestion.
Each table is associated with a tenant. A segment resides on the server, which has the same tenant as itself. For more details on how tenants work, see .
You can also override if a table should move to a server with different tenant based on segment status.
A tagOverrideConfig can be added under the tenants section for realtime tables, to override tags for consuming and completed segments. For example:
In the above example, the consuming segments will still be assigned to serverTenantName_REALTIME hosts, but once they are completed, the segments will be moved to serverTeantnName_OFFLINE. It is possible to specify the full name of any tag in this section (so, for example, you could decide that completed segments for this table should be in pinot servers tagged as allTables_COMPLETED). To learn more about this config, see the section.
A hybrid table is a table composed of 2 tables, one offline and one real-time that share the same name. In such a table, offline segments may be pushed periodically. The retention on the offline table can be set to a high value since segments are coming in on a periodic basis, whereas the retention on the real-time part can be small.
Once an offline segment is pushed to cover a recent time period, the brokers automatically switch to using the offline table for segments for that time period and use the real-time table only for data not available in the offline table.
To understand how time boundary works in the case of a hybrid table, see .
A typical scenario is pushing a deduped cleaned up data into an offline table every day while consuming real-time data as and when it arrives. The data can be kept in offline tables for even a few years while the real-time data would be cleaned every few days.
Create a table config for your data, or see for all possible batch/streaming tables.
Prerequisites
Sample Console Output
Check out the table config in the to make sure it was successfully uploaded.
Start Kafka
Create a Kafka Topic
Create a Streaming table
Sample output
Start Kafka-Zookeeper
Start Kafka
Check out the table config in the to make sure it was successfully uploaded.
Forward Index
The values for every column are stored in a forward index, of which there are three types:
Dictionary encoded forward index
Builds a dictionary mapping 0 indexed ids to each unique value in a column and a forward index that contains the bit-compressed ids.
Sorted forward index
Builds a dictionary mapping from each unique value to a pair of start and end document id and a forward index on top of the dictionary encoding.
Builds a forward index of the column's values.
To save segment storage space the forward index can now be while creating new tables.
Each unique value from a column is assigned an id and a dictionary is built that maps the id to the value. The forward index stores bit-compressed ids instead of the values. If you have few unique values, dictionary-encoding can significantly improve space efficiency.
The below diagram shows the dictionary encoding for two columns with integer and string types. ForcolA, dictionary encoding saved a significant amount of space for duplicated values.
On the other hand, colB has no duplicated data. Dictionary encoding will not compress much data in this case where there are a lot of unique values in the column. For the string type, we pick the length of the longest value and use it as the length for the dictionary’s fixed-length value array. The padding overhead can be high if there are a large number of unique values for a column.
When a column is physically sorted, Pinot uses a sorted forward index with run-length encoding on top of the dictionary-encoding. Instead of saving dictionary ids for each document id, Pinot will store a pair of start and end document ids for each value.
(For simplicity, this diagram does not include the dictionary encoding layer.)
The Sorted forward index has the advantages of both good compression and data locality. The Sorted forward index can also be used as an inverted index.
A sorted index can be configured for a table by setting it in the table config:
Real-time data ingestion will sort data by the sortedColumn when generating segments - you don't need to pre-sort the data.
When a segment is committed, Pinot will do a pass over the data in each column and create a sorted index for any other columns that contain sorted data, even if they aren't specified as the sortedColumn.
For offline data ingestion, Pinot will do a pass over the data in each column and create a sorted index for columns that contain sorted data.
This means that if you want a column to have a sorted index, you will need to sort the data by that column before ingesting it into Pinot.
If you are ingesting multiple segments you will need to make sure that data is sorted within each segment - you don't need to sort the data across segments.
You can check the sorted status of a column in a segment by running the following:
Alternatively, for offline tables and for committed segments in real-time tables, you can retrieve the sorted status from the getServerMetadata endpoint. The following example is based on the :
The raw value forward index directly stores values instead of ids.
Without the dictionary, the dictionary lookup step can be skipped for each value fetch. The index can also take advantage of the good locality of the values, thus improving the performance of scanning a large number of values.
The raw value forward index works well for columns that have a large number of unique values where a dictionary does not provide much compression.
As seen in the above diagram, using dictionary encoding will require a lot of random accesses of memory to do those dictionary look-ups. With a raw value forward index, we can scan values sequentially, which can result in improved query performance when applied appropriately.
A raw value forward index can be configured for a table by configuring the , as shown below:
When working out whether a column should use dictionary encoded or raw value encoding, the following comparison table may help:
Dictionary
Raw Value
Traditionally the forward index has been a mandatory index for all columns in the on-disk segment file format.
However, certain columns may only be used as a filter in the WHERE clause for all queries. In such scenarios the forward index is not necessary as essentially other indexes and structures in the segments can provide the required SQL query functionality. Forward index just takes up extra storage space for such scenarios and can ideally be freed up.
Thus, to provide users an option to save storage space, a knob to disable the forward index is now available.
Forward index on one or more columns(s) in your Pinot table can be disabled with the following limitations:
Only supported for immutable (offline) segments.
If the column has a range index then the column must be of single-value type and use range index version 2
MV columns with duplicates within a row will lose the duplicated entries on forward index regeneration. The ordering of data with an MV row may also change on regeneration. A backfill is required in such scenarios (to preserve duplicates or ordering).
Sorted columns will allow the forward index to be disabled, but this operation will be treated as a no-op and the index (which acts as both a forward index and inverted index) will be created.
To disable the forward index for a given column the fieldConfigList can be modified within the , as shown below:
A table reload operation must be performed for the above config to take effect. Enabling / disabling other indexes on the column can be done via the usual options.
The forward index can also be regenerated for a column where it is disabled by removing the property forwardIndexDisabled from the fieldConfigList properties bucket and reloading the segment. The forward index can only be regenerated if the dictionary and inverted index have been enabled for the column. If either have been disabled then the only way to get the forward index back is to regenerate the segments via the offline jobs and re-push / refresh the data.
Examples of queries which will fail after disabling the forward index for an example column, columnA, can be found below:
Forward index disabled columns cannot be present in the SELECT clause even if filters are added on it.
Forward index disabled columns cannot be present in the GROUP BY and ORDER BY clauses. They also cannot be part of the HAVING clause.
A subset of the aggregation functions do work when the forward index is disabled such as MIN, MAX, DISTINCTCOUNT, DISTINCTCOUNTHLL and more. Some of the other aggregation functions will not work such as the below:
Forward index disabled columns cannot be present in the SELECT DISTINCT clause.
To run queries on single-value columns where the filter clause contains operators such as >, <, >=, <= a version 2 range index must be present. Without the range index such queries will fail as shown below:
Max time duration to wait - Pinot consumers wait for the configured time duration after which segments are persisted to the disk.
Offline tables ingest pre-built pinot-segments from external data stores. This is generally used for batch ingestion.
Realtime
Realtime tables ingest data from streams (such as Kafka) and build segments from the consumed data.
Hybrid
A hybrid Pinot table has both realtime as well as offline tables under the hood. By default, all tables in Pinot are Hybrid in nature.
The user querying the database does not need to know the type of the table. They only need to specify the table name in the query.
e.g. regardless of whether we have an offline table myTable_OFFLINE, a real-time table myTable_REALTIME, or a hybrid table containing both of these, the query will be:
Segments
Flush
Indexing
Pre-aggregation
Tenants
Hybrid Table
Examples
Offline Table Creation
Streaming Table Creation
Hybrid Table creation
Creating a hybrid table has to be done in 2 separate steps of creating an offline and real-time table individually. You don't need to create a separate overlay/hybrid table.
For Strings, adds padding to make all values equal length in the dictionary
Chunk de-compression overhead with docs selected don't have spatial locality
If forward index regeneration support on reload (i.e. re-enabling the forward index for a forward index disabled column) is required then the dictionary and inverted index must be enabled on that particular column.
SELECT SUM(columnB), columnA
FROM myTable
GROUP BY columnA
ORDER BY columnA
SELECT MIN(columnA)
FROM myTable
GROUP BY columnB
HAVING MIN(columnA) > 100
ORDER BY columnB
SELECT SUM(columnA), AVG(columnA)
FROM myTable
SELECT MAX(ADD(columnA, columnB))
FROM myTable
SELECT DISTINCT columnA
FROM myTable
SELECT columnB
FROM myTable
WHERE columnA > 1000
Dictionary-encoded forward index with bit compression (default)
Sorted forward index with run-length encoding
Real-time tables
Note: A Pinot table can only have 1 sorted column
Offline tables
Checking sort status
Raw value forward index
Dictionary encoded vs raw value
Disabling the forward index
Warning:
For multi-value (MV) columns the following invariants cannot be maintained after regenerating the forward index for a forward index disabled column:
Ordering guarantees of the MV values within a row
If entries within an MV row are duplicated, the duplicates will be lost. Please regenerate the segments via your offline jobs and re-push / refresh the data to get back the original MV data with duplicates.
We will work on removing the second invariant in the future.
Eliminates additional dereferencing, so good when all docs of interest are contiguous
Architecture
This page covers everything you need to know about how queries are computed in Pinot's distributed systems architecture.
This page will introduce you to the guiding principles behind the design of Apache Pinot. Here you will learn the distributed systems architecture that allows Pinot to scale the performance of queries linearly based on the number of nodes in a cluster. You'll also be introduced to the two different types of tables used to ingest and query data in offline (batch) or real-time (stream) mode.
It's recommended that you read to better understand the terms used in this guide.
Guiding design principles
Pinot was designed by engineers at LinkedIn and Uber to scale query performance based on the number of nodes in a cluster. As you add more nodes, query performance will always improve based on the expected query volume per second quota. To achieve horizontal scalability to an unbounded number of nodes and data storage, without performance degradation, the following guiding design principles were established.
Highly available: Pinot is built to serve low latency analytical queries for customer facing applications. By design, there is no single point of failure in Pinot. The system continues to serve queries when a node goes down.
Horizontally scalable: Ability to scale by adding new nodes as a workload changes.
Latency vs Storage: Pinot is built to provide low latency even at high-throughput. Features such as segment assignment strategy, routing strategy, star-tree indexing were developed to achieve this.
Immutable data: Pinot assumes that all data stored is immutable. For GDPR compliance, we provide an add-on solution for purging data while maintaining performance guarantees.
Dynamic configuration changes: Operations such as adding new tables, expanding a cluster, ingesting data, modifying indexing config, and re-balancing must be performed without impacting query availability or performance.
As described in the , Pinot has multiple distributed system components:, , , and .
Pinot uses for cluster management. Helix is embedded as an agent within the different components and uses for coordination and maintaining the overall cluster state and health.
All Pinot and are managed by Helix. Helix is a generic cluster management framework to manage partitions and replicas in a distributed system. It's helpful to think of Helix as an event-driven discovery service with push and pull notifications that drives the state of a cluster to an ideal configuration. A finite-state machine maintains a contract of stateful operations that drives the health of the cluster towards its optimal configuration. Query load is optimized as Helix updates routing configurations between nodes based on where data is stored in the cluster.
Helix divides nodes into three logical components based on their responsibilities:
Participant: These are the nodes in the cluster that actually host the distributed storage resources.
Spectator: These nodes observe the current state of each participant and routes requests accordingly. Routers, for example, need to know the instance on which a partition is hosted and its state in order to route the request to the appropriate endpoint. Routing is continually being changed to optimize cluster performance as storage primitives are added and changed.
Controller: The
Helix uses Zookeeper to maintain cluster state. Each component in a Pinot cluster takes a Zookeeper address as a startup parameter. The various components that are distributed in a Pinot cluster will watch Zookeeper notifications and issue updates via its embedded Helix-defined agent.
Helix agents use Zookeeper to store and update configurations, as well as for distributed coordination. Zookeeper stores the following information about the cluster:
Knowing the ZNode layout structure in Zookeeper for Helix agents in a cluster is useful for operations and/or troubleshooting cluster state and health.
Pinot's acts as the driver of the cluster's overall state and health. Because of its role as a Helix participant and spectator, which drives the state of other components, it is the first component that is typically started after Zookeeper. Two parameters are required for starting a controller: Zookeeper address and cluster name. The controller will automatically create a cluster via Helix if it does not yet exist.
To achieve fault tolerance, one can start multiple controllers (typically three) and one of them will act as a leader. If the leader crashes or dies, another leader is automatically elected. Leader election is achieved using Apache Helix. Having at-least one controller is required to perform any DDL equivalent operation on the cluster, such as adding a table or a segment.
The controller does not interfere with query execution. Query execution is not impacted even when all controllers nodes are offline. If all controller nodes are offline, the state of the cluster will stay as it was when the last leader went down. When a new leader comes online, a cluster resumes re-balancing activity and can accept new tables or segments.
The provides a REST interface to perform CRUD operations on all logical storage resources (servers, brokers, tables, and segments).
The responsibility of the is to route a given query to an appropriate instance. A broker will collect and merge the responses from all servers into a final result and send it back to the requesting client. The broker provides HTTP endpoints that accept SQL queries and returns the response in JSON format.
Brokers need three key things to start.
Cluster name
Zookeeper address
Broker instance name
At the start, a broker registers as a Helix Participant and awaits notifications from other Helix agents. These notifications will be handled for table creation, a new segment being loaded, or a server starting up/or going down, in addition to any configuration changes.
Service Discovery/Routing Table
Irrespective of the kind of notification, the key responsibility of a broker is to maintain the query routing table. The query routing table is simply a mapping between segments and the servers that a segment resides on. Typically, a segment resides on more than one server. The broker computes multiple routing tables depending on the configured routing strategy for a table. The default strategy is to balance the query load across all available servers.
Query processing
For every query, a cluster's broker performs the following:
Fetches the routes that are computed for a query based on the routing strategy defined in a configuration.
Computes the list of segments to query from on each .
Scatter-Gather: sends the requests to each server and gathers the responses.
Fault tolerance
Broker instances scale horizontally without an upper bound. In a majority of cases, only three brokers are required. If most query results that are returned to a client are <1MB in size per query, one can run a broker and servers inside the same instance container. This lowers the overall footprint of a cluster deployment for use cases that do not need to guarantee a strict SLA on query performance in production.
host and do most of the heavy lifting during query processing. Though the architecture shows that there are two kinds of servers, real-time and offline, a server does not really know if it's going to be a real-time server or an offline server. The responsibility of a server depends on the assignment strategy.
Offline servers
Offline servers typically host segments that are immutable. In this case, segments are created outside of a cluster and uploaded via a shell-based request. Based on the replication factor and the segment assignment strategy, the controller picks one or more servers to host the segment. Servers are notified via Helix about the new segments. Servers fetch the segments from deep store and load them before being ready to serve query requests. At this point, the cluster's detects that new segments are available and starts including them in query responses.
Real-time servers
Real-time servers are different from the offline servers. Real-time nodes ingest data from streaming sources, such as Kafka, and generate the indexed segments in-memory (flushing segments to disk periodically). In memory segments are also known as consuming segments. These consuming segments get flushed periodically based on completion threshold (based on number of rows, time or segment size). At this point, they are known as completed segments. Completed segments are similar to the offline server's segments. Queries go over the in-flight (consuming) segments and the completed segments.
is an optional component and is not required to get started with Pinot. Minion is used for purging data from a Pinot cluster (for reasons such as GDPR compliance in the UK).
Within Pinot, a logical is modeled as one of two types of physical tables: offline or real-time. The reason for having two types of tables is because each one follows a different state model.
A real-time and offline table provide different configuration options for indexing and, in the case of real-time, the connector properties for the stream data source (i.e. Kafka). Table types also allow users to use different containers for real-time and offline nodes. For instance, offline servers might use virtual machines with larger storage capacity where real-time servers might need higher system memory and/or more CPU cores.
The two types of tables also scale differently.
Real-time tables have a smaller retention period and scales query performance based on the ingestion rate.
Offline tables have larger retention and scales performance based on the size of stored data.
There are a few things to keep in mind when configuring the different types of tables for your workloads. When ingesting data from the same source, you can have two tables that ingest the same data that are configured differently for real-time and offline queries. Even though the two tables have the same data, performance will scale differently for queries based on your requirements. In this scenario, real-time and offline tables must share the same .
In batch mode, data is ingested into Pinot via an . An ingestion job transforms a raw data source (such as a CSV file) into . Once segments are generated for the imported data, an ingestion job stores them into the cluster's segment store (a.k.a deep store) and notifies the . The notification is processed and the result is that the Helix agent on the controller updates the ideal state configuration in Zookeeper. Helix will then notify the offline that there are new segments available. In response to the notification from the controller, the offline server downloads the newly created segments directly from the cluster's segment store. The cluster's broker, which watches for state changes in Helix, detects the new segments and adds them to the list of segments to query (segment-to-server routing table).
At table creation, a controller creates a new entry in Zookeeper for the consuming segment. Helix notices the new segment and notifies the real-time server, which starts consuming data from the streaming source. The broker, which watches for changes, detects the new segments and adds them to the list of segments to query (segment-to-server routing table).
Whenever the segment is complete (i.e. full), the real-time server notifies the Controller, which checks with all replicas and picks a winner to commit the segment to. The winner commits the segment and uploads it to the cluster's segment store, updating the state of the segment from "consuming" to "online". The controller then prepares a new segment in a "consuming" state.
Queries are received by brokers—which checks the request against the segment-to-server routing table—scattering the request between real-time and offline servers.
The two tables then process the request by filtering and aggregating the queried data, which is then returned back to the broker. Finally, the broker gathers together all of the pieces of the query response and responds back to the client with the result.
Batch import example
Step-by-step guide on pushing your own data into the Pinot cluster
So far, we have set up our cluster, ran some queries, and explored the admin endpoints. Now, it's time to get our own data into Pinot. The rest of the instructions assume you're using Pinot in Docker.
Preparing your data
Let's gather our data files and put them in pinot-quick-start/rawdata.
mkdir -p /tmp/pinot-quick-start/rawdata
Supported file formats are CSV, JSON, AVRO, PARQUET, THRIFT, ORC. If you don't have sample data, you can use this sample CSV.
Schema is used to define the columns and data types of the Pinot table. A detailed overview of the schema can be found in Schema.
Briefly, we categorize our columns into 3 types
Column Type
Description
For example, in our sample table, the studentID,firstName,lastName,gender,subject columns are the dimensions, the score column is the metric and timestampInEpoch is the time column.
Once you have identified the dimensions, metrics and time columns, create a schema for your data, using the reference below.
A table config is used to define the config related to the Pinot table. A detailed overview of the table can be found in .
Here's the table config for the sample CSV file. You can use this as a reference to build your own table config. Simply edit the tableName and schemaName.
Check the directory structure so far
Upload the table config using the following command
Check out the table config and schema in the to make sure it was successfully uploaded.
A Pinot table's data is stored as Pinot segments. A detailed overview of the segment can be found in .
To generate a segment, we need to first create a job spec yaml file. JobSpec yaml file has all the information regarding data format, input data location and pinot cluster coordinates. You can just copy over this job spec file. If you're using your own data, be sure to 1) replace transcript with your table name 2) set the right recordReaderSpec
Use the following command to generate a segment and upload it
Sample output
Check that your segment made it to the table using the
You're all set! You should see your table in the and be able to run queries against it now.
0.6.0
This release introduced some excellent new features, including upsert, tiered storage, pinot-spark-connector, support of having clause, more validations on table config and schema, support of ordinals
Summary
This release introduced some excellent new features, including upsert, tiered storage, pinot-spark-connector, support of having clause, more validations on table config and schema, support of ordinals in GROUP BY and ORDER BY clause, array transform functions, adding push job type of segment metadata only mode, and some new APIs like updating instance tags, new health check endpoint. It also contains many key bug fixes. See details below.
The release was cut from the following commit:
e5c9bec and the following cherry-picks:
Deep Extraction Support for ORC, Thrift, and ProtoBuf Records ()
Lookup UDF Join
Lookup UDF is used to get dimension data via primary key from a dimension table allowing a decoration join functionality. Lookup UDF can only be used with a dimension table in Pinot.
dimTable Name of the dim table to perform the lookup on.
dimColToLookUp The column name of the dim table to be retrieved to decorate our result.
dimJoinKey The column name on which we want to perform the lookup i.e. the join column name for dim table.
factJoinKey The column name on which we want to perform the lookup against e.g. the join column name for fact table
Noted that:
all the dim-table-related expressions are expressed as literal strings, this is the LOOKUP UDF syntax limitation: we cannot express column identifier which doesn't exist in the query's main table, which is the factTable table.
the syntax definition of [ '''dimJoinKey''', factJoinKey ]* indicates that if there are multiple dim partition columns, there should be multiple join key pair expressed.
Here are some of the examples
Consider the table baseballStats
Column
Type
and dim table dimBaseballTeams
Column
Type
several acceptable queries are:
playerName
teamID
teamName
teamAddress
teamID
nameFromLocal
nameFromLookup
Consider a single dimension table with schema:
BILLING SCHEMA
Column
Type
customerId
missedPayment
lookedupCity
The data return type of the UDF will be that of the dimColToLookUp column type.
when multiple primary key columns are used for the dimension table (e.g. composite primary key), please ensure that the order of keys appearing in the lookup() UDF is the same as the order defined in the primaryKeyColumns from the dimension table schema.
league
STRING
playerName
STRING
playerStint
INT
numberOfGames
INT
numberOfGamesAsBatter
INT
AtBatting
INT
runs
INT
CHA
null
null
David Allan
SEA
Seattle Mariners (since 1977) or Seattle Pilots (1969)
1250 First Avenue South, Seattle, WA
David Allan
SEA
Seattle Mariners (since 1977) or Seattle Pilots (1969)
1250 First Avenue South, Seattle, WA
Arizona Diamondbacks
ATL
Atlanta Braves
Atlanta Braves
BAL
Baltimore Orioles (original- 1901–1902 current- since 1954)
Baltimore Orioles (original- 1901–1902 current- since 1954)
lastName
STRING
isCarOwner
BOOLEAN
city
STRING
maritalStatus
STRING
buildingType
STRING
missedPayment
STRING
billingMonth
STRING
Mountain View
398
Paid
Palo Alto
427
Paid
Cupertino
435
Paid
Cupertino
playerID
STRING
yearID
INT
teamID
teamID
STRING
teamName
STRING
teamAddress
David Allan
BOS
Boston Red Caps/Beaneaters (from 1876–1900) or Boston Red Sox (since 1953)
4 Jersey Street, Boston, MA
ANA
Anaheim Angels
Anaheim Angels
ARI
Arizona Diamondbacks
customerId
INT
creditHistory
STRING
firstName
341
Paid
Palo Alto
374
Examples
Single-partition-key-column Example
Dim-Fact LOOKUP example
Self LOOKUP example
Complex-partition-key-columns Example
Self LOOKUP example
Usage FAQ
STRING
STRING
David Allan
STRING
Paid
SELECT
playerName,
teamID,
LOOKUP('dimBaseballTeams', 'teamName', 'teamID', teamID) AS teamName,
LOOKUP('dimBaseballTeams', 'teamAddress', 'teamID', teamID) AS teamAddress
FROM baseballStats
SELECT
teamID,
teamName AS nameFromLocal,
LOOKUP('dimBaseballTeams', 'teamName', 'teamID', teamID) AS nameFromLookup
FROM dimBaseballTeams
select
customerId,
missedPayment,
LOOKUP('billing', 'city', 'customerId', customerId, 'creditHistory', creditHistory) AS lookedupCity
from billing
observes and manages the state of participant nodes. The controller is responsible for coordinating all state transitions in the cluster and ensures that state constraints are satisfied while maintaining cluster stability.
Embeds the Helix agent that drives the overall state of the cluster.
Server
is modeled as a Helix Participant and hosts .
Broker
Broker is modeled as a Helix Spectator that observes the cluster for changes in the state of segments and servers. In order to support multi-tenancy, brokers are also modeled as Helix Participants.
Minion
Pinot Minion is modeled as a Helix Participant.
List of tables
Table configurations
Table schema information
Segment
Exact server location(s) of a segment (routing table)
State of each segment (online/offline/error/consuming)
Meta data about each segment
Merge: merges the query results returned from each server.
Sends the query result to the client.
Component
Helix Mapping
Segment
Modeled as a Helix Partition. Each segment can have multiple copies referred to as Replicas.
Table
Modeled as a Helix Resource. Multiple segments are grouped into a table. All segments belonging to a Pinot Table have the same schema.
Resource
Stored Properties
Controller
The controller that is assigned as the current leader
Servers/Brokers
A list of servers/brokers and their configuration
Health status
//This is an example ZNode config for EXTERNAL VIEW in Helix
{
"id" : "baseballStats_OFFLINE",
"simpleFields" : {
...
},
"mapFields" : {
"baseballStats_OFFLINE_0" : {
"Server_10.1.10.82_7000" : "ONLINE"
}
},
...
}
There are advanced routing strategies available such as ReplicaAware routing, partition-based routing, and minimal server selection routing. These strategies are meant for special or generic cases that are meant to serve very high throughput queries.
Server
In theory, a server can host both real-time segments and offline segments. However, in practice, we use different types of machine SKUs for real-time servers and offline servers. The advantage of separating real-time servers and offline servers is to allow each to scale independently.
Minion
Data ingestion overview
Tables for real-time and offline can be configured differently depending on usage requirements. For example, you can choose to enable star-tree indexing for an offline table, while the real-time table with the same schema may not need it.
Pinot Components have to be deployed in the following order:
(PinotServiceManager -> Bootstrap services in role ServiceRole.CONTROLLER -> All remaining bootstrap services in parallel)
Starts Broker and Server in parallel when using ServiceManager (#5917)
New settings introduced and old ones deprecated:
Make realtime threshold property names less ambiguous ()
Change Signature of Broker API in Controller ()
This aggregation function is still in beta version. This PR involves change on the format of data sent from server to broker, so it works only when both broker and server are upgraded to the new version:
SegmentGenerationJobSpec:
!!org.apache.pinot.spi.ingestion.batch.spec.SegmentGenerationJobSpec
excludeFileNamePattern: null
executionFrameworkSpec: {extraConfigs: null, name: standalone, segmentGenerationJobRunnerClassName: org.apache.pinot.plugin.ingestion.batch.standalone.SegmentGenerationJobRunner,
segmentTarPushJobRunnerClassName: org.apache.pinot.plugin.ingestion.batch.standalone.SegmentTarPushJobRunner,
segmentUriPushJobRunnerClassName: org.apache.pinot.plugin.ingestion.batch.standalone.SegmentUriPushJobRunner}
includeFileNamePattern: glob:**\/*.csv
inputDirURI: /tmp/pinot-quick-start/rawdata/
jobType: SegmentCreationAndTarPush
outputDirURI: /tmp/pinot-quick-start/segments
overwriteOutput: true
pinotClusterSpecs:
- {controllerURI: 'http://localhost:9000'}
pinotFSSpecs:
- {className: org.apache.pinot.spi.filesystem.LocalPinotFS, configs: null, scheme: file}
pushJobSpec: null
recordReaderSpec: {className: org.apache.pinot.plugin.inputformat.csv.CSVRecordReader,
configClassName: org.apache.pinot.plugin.inputformat.csv.CSVRecordReaderConfig,
configs: null, dataFormat: csv}
segmentNameGeneratorSpec: null
tableSpec: {schemaURI: 'http://localhost:9000/tables/transcript/schema', tableConfigURI: 'http://localhost:9000/tables/transcript',
tableName: transcript}
Trying to create instance for class org.apache.pinot.plugin.ingestion.batch.standalone.SegmentGenerationJobRunner
Initializing PinotFS for scheme file, classname org.apache.pinot.spi.filesystem.LocalPinotFS
Finished building StatsCollector!
Collected stats for 4 documents
Using fixed bytes value dictionary for column: studentID, size: 9
Created dictionary for STRING column: studentID with cardinality: 3, max length in bytes: 3, range: 200 to 202
Using fixed bytes value dictionary for column: firstName, size: 12
Created dictionary for STRING column: firstName with cardinality: 3, max length in bytes: 4, range: Bob to Nick
Using fixed bytes value dictionary for column: lastName, size: 15
Created dictionary for STRING column: lastName with cardinality: 3, max length in bytes: 5, range: King to Young
Created dictionary for FLOAT column: score with cardinality: 4, range: 3.2 to 3.8
Using fixed bytes value dictionary for column: gender, size: 12
Created dictionary for STRING column: gender with cardinality: 2, max length in bytes: 6, range: Female to Male
Using fixed bytes value dictionary for column: subject, size: 21
Created dictionary for STRING column: subject with cardinality: 3, max length in bytes: 7, range: English to Physics
Created dictionary for LONG column: timestampInEpoch with cardinality: 4, range: 1570863600000 to 1572418800000
Start building IndexCreator!
Finished records indexing in IndexCreator!
Finished segment seal!
Converting segment: /var/folders/3z/qn6k60qs6ps1bb6s2c26gx040000gn/T/pinot-1583443148720/output/transcript_OFFLINE_1570863600000_1572418800000_0 to v3 format
v3 segment location for segment: transcript_OFFLINE_1570863600000_1572418800000_0 is /var/folders/3z/qn6k60qs6ps1bb6s2c26gx040000gn/T/pinot-1583443148720/output/transcript_OFFLINE_1570863600000_1572418800000_0/v3
Deleting files in v1 segment directory: /var/folders/3z/qn6k60qs6ps1bb6s2c26gx040000gn/T/pinot-1583443148720/output/transcript_OFFLINE_1570863600000_1572418800000_0
Starting building 1 star-trees with configs: [StarTreeV2BuilderConfig[splitOrder=[studentID, firstName],skipStarNodeCreation=[],functionColumnPairs=[org.apache.pinot.core.startree.v2.AggregationFunctionColumnPair@3a48efdc],maxLeafRecords=1]] using OFF_HEAP builder
Starting building star-tree with config: StarTreeV2BuilderConfig[splitOrder=[studentID, firstName],skipStarNodeCreation=[],functionColumnPairs=[org.apache.pinot.core.startree.v2.AggregationFunctionColumnPair@3a48efdc],maxLeafRecords=1]
Generated 3 star-tree records from 4 segment records
Finished constructing star-tree, got 9 tree nodes and 4 records under star-node
Finished creating aggregated documents, got 6 aggregated records
Finished building star-tree in 10ms
Finished building 1 star-trees in 27ms
Computed crc = 3454627653, based on files [/var/folders/3z/qn6k60qs6ps1bb6s2c26gx040000gn/T/pinot-1583443148720/output/transcript_OFFLINE_1570863600000_1572418800000_0/v3/columns.psf, /var/folders/3z/qn6k60qs6ps1bb6s2c26gx040000gn/T/pinot-1583443148720/output/transcript_OFFLINE_1570863600000_1572418800000_0/v3/index_map, /var/folders/3z/qn6k60qs6ps1bb6s2c26gx040000gn/T/pinot-1583443148720/output/transcript_OFFLINE_1570863600000_1572418800000_0/v3/metadata.properties, /var/folders/3z/qn6k60qs6ps1bb6s2c26gx040000gn/T/pinot-1583443148720/output/transcript_OFFLINE_1570863600000_1572418800000_0/v3/star_tree_index, /var/folders/3z/qn6k60qs6ps1bb6s2c26gx040000gn/T/pinot-1583443148720/output/transcript_OFFLINE_1570863600000_1572418800000_0/v3/star_tree_index_map]
Driver, record read time : 0
Driver, stats collector time : 0
Driver, indexing time : 0
Tarring segment from: /var/folders/3z/qn6k60qs6ps1bb6s2c26gx040000gn/T/pinot-1583443148720/output/transcript_OFFLINE_1570863600000_1572418800000_0 to: /var/folders/3z/qn6k60qs6ps1bb6s2c26gx040000gn/T/pinot-1583443148720/output/transcript_OFFLINE_1570863600000_1572418800000_0.tar.gz
Size for segment: transcript_OFFLINE_1570863600000_1572418800000_0, uncompressed: 6.73KB, compressed: 1.89KB
Trying to create instance for class org.apache.pinot.plugin.ingestion.batch.standalone.SegmentTarPushJobRunner
Initializing PinotFS for scheme file, classname org.apache.pinot.spi.filesystem.LocalPinotFS
Start pushing segments: [/tmp/pinot-quick-start/segments/transcript_OFFLINE_1570863600000_1572418800000_0.tar.gz]... to locations: [org.apache.pinot.spi.ingestion.batch.spec.PinotClusterSpec@243c4f91] for table transcript
Pushing segment: transcript_OFFLINE_1570863600000_1572418800000_0 to location: http://localhost:9000 for table transcript
Sending request: http://localhost:9000/v2/segments?tableName=transcript to controller: nehas-mbp.hsd1.ca.comcast.net, version: Unknown
Response for pushing table transcript segment transcript_OFFLINE_1570863600000_1572418800000_0 to location http://localhost:9000 - 200: {"status":"Successfully uploaded segment: transcript_OFFLINE_1570863600000_1572418800000_0 of table: transcript"}
A Minion is a standby component that leverages the Helix Task Framework to offload computationally intensive tasks from other components.
It can be attached to an existing Pinot cluster and then execute tasks as provided by the controller. Custom tasks can be plugged via annotations into the cluster. Some typical minion tasks are:
Segment creation
Segment purge
Segment merge
Make sure you've . If you're using docker, make sure to . To start a minion
PinotTaskGenerator interface defines the APIs for the controller to generate tasks for minions to execute.
Factory for PinotTaskExecutor which defines the APIs for Minion to execute the tasks.
Factory for MinionEventObserver which defines the APIs for task event callbacks on minion.
The PushTask can fetch files from an input folder e.g. from a S3 bucket and converts them into segments. The PushTask converts one file into one segment and keeps file name in segment metadata to avoid duplicate ingestion. Below is an example task config to put in TableConfig to enable this task. The task is scheduled every 10min to keep ingesting remaining files, with 10 parallel task at max and 1 file per task.
NOTE: You may want to simply omit "tableMaxNumTasks" due to this caveat: the task generates one segment per file, and derives segment name based on the time column of the file. If two files happen to have same time range and are ingested by tasks from different schedules, there might be segment name conflict. To overcome this issue for now, you can omit “tableMaxNumTasks” and by default it’s Integer.MAX_VALUE, meaning to schedule as many tasks as possible to ingest all input files in a single batch. Within one batch, a sequence number suffix is used to ensure no segment name conflict. Because the sequence number suffix is scoped within one batch, tasks from different batches might encounter segment name conflict issue said above.
See for details.
See for details.
Tasks are enabled on a per-table basis. To enable a certain task type (e.g. myTask) on a table, update the table config to include the task type:
Under each enable task type, custom properties can be configured for the task type.
There are also two task configs to be set as part of cluster configs like below. One controls task's overall timeout (1hr by default) and one for how many tasks to run on a single minion worker (1 by default).
There are 2 ways to enable task scheduling:
Tasks can be scheduled periodically for all task types on all enabled tables. Enable auto task scheduling by configuring the schedule frequency in the controller config with the key controller.task.frequencyPeriod. This takes period strings as values, e.g. 2h, 30m, 1d.
Tasks can also be scheduled based on cron expressions. The cron expression is set in the schedule config for each task type separately. This config in the controller config, controller.task.scheduler.enabled should be set to true to enable cron scheduling.
As shown below, the RealtimeToOfflineSegmentsTask will be scheduled at the first second of every minute (following the syntax ).
Tasks can be manually scheduled using the following controller rest APIs:
Rest API
Description
To plug in a custom task, implement PinotTaskGenerator, PinotTaskExecutorFactory and MinionEventObserverFactory (optional) for the task type (all of them should return the same string for getTaskType()), and annotate them with the following annotations:
Implementation
Annotation
After annotating the classes, put them under the package of name org.apache.pinot.*.plugin.minion.tasks.*, then they will be auto-registered by the controller and minion.
See where the TestTask is plugged-in.
In Pinot UI, there is Minion Task Manager tab under Cluster Manager page. From that minion task manager tab, one can find a lot of task related info for troubleshooting. Those info are mainly collected from the Pinot controller that schedules tasks or Helix that tracks task runtime status. There are also buttons to schedule tasks in an ad hoc way. Below are some brief introductions to some pages under the minion task manager tab.
This one shows which types of Minion Task have been used. Essentially which task types have created their task queues in Helix.
Clicking into a task type, one can see the tables using that task. And a few buttons to stop the task queue, cleaning up ended tasks etc.
Then clicking into any table in this list, one can see how the task is configured for that table. And the task metadata if there is one in ZK. For example, MergeRollupTask tracks a watermark in ZK. If the task is cron scheduled, the current and next schedules are also shown in this page like below.
At the bottom of this page, one can see a list of tasks generated for this table for this specific task type. Like here, one MergeRollup task has been generated and completed.
Clicking into a task from that list, we can see start/end time for it, and the sub tasks generated for that task (as context, one minion task can have multiple sub-tasks to process data in parallel). In this example, it happened to have one sub-task here, and it shows when it starts and stops and which minion worker it's running.
Clicking into this subtask, one can see more details about it like the input task configs and error info if the task failed.
There is a controller job that runs every 5 minutes by default and emits metrics about Minion tasks scheduled in Pinot. The following metrics are emitted for each task type:
NumMinionTasksInProgress: Number of running tasks
NumMinionSubtasksRunning: Number of running sub-tasks
NumMinionSubtasksWaiting: Number of waiting sub-tasks (unassigned to a minion as yet)
The controller also emits metrics about how tasks are cron scheduled:
cronSchedulerJobScheduled: Number of current cron schedules registered to be triggered regularly according their cron expressions. It's a Gauge.
cronSchedulerJobTrigger: Number of cron scheduled triggered, as a Meter.
cronSchedulerJobSkipped: Number of late cron scheduled skipped, as a Meter.
For each task, the Minion will emit these metrics:
TASK_QUEUEING: Task queueing time (task_dequeue_time - task_inqueue_time), assuming the time drift between helix controller and pinot minion is minor, otherwise the value may be negative
TASK_EXECUTION: Task execution time, which is the time spent on executing the task
NUMBER_OF_TASKS: number of tasks in progress on that minion. Whenever a Minion starts a task, increase the Gauge by 1, whenever a Minion completes (either succeeded or failed) a task, decrease it by 1
Batch Ingestion
Batch ingestion allows users to create a table using data already present in a file system such as S3. This is particularly useful for the cases where the user wants to utilize Pinot's ability to query large data with minimal latency or test out new features using a simple data file.
Ingesting data from a filesystem involves the following steps -
Define Schema
Define Table Config
Upload Schema and Table configs
Upload data
Batch Ingestion currently supports the following mechanisms to upload the data -
Standalone
Here we'll take a look at the standalone local processing to get you started.
Let's create a table for the following CSV data source.
In our data, the only column on which aggregations can be performed is score. Secondly, timestampInEpoch is the only timestamp column. So, on our schema, we keep score as metric and timestampInEpoch as timestamp column.
Here, we have also defined two extra fields - format and granularity. The format specifies the formatting of our timestamp column in the data source. Currently, it is in milliseconds hence we have specified 1:MILLISECONDS:EPOCH
We define a tabletranscriptand map the schema created in the previous step to the table. For batch data, we keep the tableType as OFFLINE
Now that we have both the configs, we can simply upload them and create a table. To achieve that, just run the command -
Check out the table config and schema in the [Rest API] to make sure it was successfully uploaded.
We now have an empty table in pinot. So as the next step we will upload our CSV file to this table.
A table is composed of multiple segments. The segments can be created using three ways
1) Minion based ingestion
2) Upload API
3) Ingestion jobs
Refer to
There are 2 Controller APIs that can be used for a quick ingestion test using a small file.
This API creates a segment using the given file and pushes it to Pinot. All steps happen on the controller. Example usage:
To upload a JSON file data.json to a table called foo_OFFLINE, use below command
Note that query params need to be URLEncoded. For example, {"inputFormat":"json"} in the command below needs to be converted to %7B%22inputFormat%22%3A%22json%22%7D.
The batchConfigMapStr can be used to pass in additional properties needed for decoding the file. For example, in case of csv, you may need to provide the delimiter
This API creates a segment using file at the given URI and pushes it to Pinot. Properties to access the FS need to be provided in the batchConfigMap. All steps happen on the controller.
Example usage:
Segments can be created and uploaded using tasks known as DataIngestionJobs. A job also needs a config of its own. We call this config the JobSpec.
For our CSV file and table, the job spec should look like below.
You can refer to for more details.
Now that we have the job spec for our table transcript , we can trigger the job using the following command
Once the job has successfully finished, you can head over to the [query console] and start playing with the data.
There are 3 ways to upload a Pinot segment:
This is the original and default push mechanism.
Tar push requires the segment to be stored locally or can be opened as an InputStream on PinotFS. So we can stream the entire segment tar file to the controller.
The push job will:
Upload the entire segment tar file to the Pinot controller.
Pinot controller will:
Save the segment into the controller segment directory(Local or any PinotFS).
Extract segment metadata.
Add the segment to the table.
This push mechanism requires the segment Tar file stored on a deep store with a globally accessible segment tar URI.
URI push is light-weight on the client-side, and the controller side requires equivalent work as the Tar push.
The push job will:
POST this segment Tar URI to the Pinot controller.
Pinot controller will:
Download segment from the URI and save it to controller segment directory(Local or any PinotFS).
Extract segment metadata.
Add the segment to the table.
This push mechanism also requires the segment Tar file stored on a deep store with a globally accessible segment tar URI.
Metadata push is light-weight on the controller side, there is no deep store download involves from the controller side.
The push job will:
Download the segment based on URI.
Extract metadata.
Upload metadata to the Pinot Controller.
Pinot Controller will:
Add the segment to the table based on the metadata.
4. Segment Metadata Push with copyToDeepStore
This extends the original Segment Metadata Push for cases, where the segments are pushed to a location not used as deep store. The ingestion job can still do metadata push but ask Pinot Controller to copy the segments into deep store. Those use cases usually happen when the ingestion jobs don't have direct access to deep store but still want to use metadata push for its efficiency, thus using a staging location to keep the segments temporarily.
NOTE: the staging location and deep store have to use same storage scheme, like both on s3. This is because the copy is done via PinotFS.copyDir interface that assumes so; but also because this does copy at storage system side, so segments don't need to go through Pinot Controller at all.
To make this work, firstly, grant Pinot controllers access to the staging location. e.g. on AWS, this may be to add access policy like below for the controller EC2 instances
Then use metadata push but add one extra config like below:
Pinot supports atomic update on segment level, which means that when data consisting of multiple segments are pushed to a table, as segments are replaced one at a time, queries to the broker during this upload phase may produce inconsistent result due to interleaving of old and new data.
See for how to enable this feature.
When pinot segment files are created in external systems (Hadoop/spark/etc), there are several ways to push those data to the Pinot Controller and Server:
Push segment to shared NFS and let pinot pull segment files from the location of that NFS. See .
Push segment to a Web server and let pinot pull segment files from the Web server with HTTP/HTTPS link. See .
Push segment to PinotFS(HDFS/S3/GCS/ADLS) and let pinot pull segment files from PinotFS URI. See and .
The first three options are supported out of the box within the Pinot package. As long your remote jobs send Pinot controller with the corresponding URI to the files it will pick up the file and allocate it to proper Pinot Servers and brokers. To enable Pinot support for PinotFS, you will need to provide configuration and proper Hadoop dependencies.
By default, Pinot does not come with a storage layer, so all the data sent, won't be stored in case of a system crash. In order to persistently store the generated segments, you will need to change controller and server configs to add deep storage. Checkout for all the info and related configs.
Since pinot is written in Java, you can set the following basic java configurations to tune the segment runner job -
Log4j2 file location with -Dlog4j2.configurationFile
Plugin directory location with -Dplugins.dir=/opt/pinot/plugins
JVM props, like -Xmx8g -Xms4G
If you are using the docker, you can set the following under JAVA_OPTS variable.
You can set -D mapreduce.map.memory.mb=8192 to set the mapper memory size when submitting the Hadoop job.
You can add config spark.executor.memory to tune the memory usage for segment creation when submitting the Spark job.
0.7.1
This release introduced several awesome new features, including JSON index, lookup-based join support, geospatial support, TLS support for pinot connections, and various performance optimizations.
Summary
This release introduced several awesome new features, including JSON index, lookup-based join support, geospatial support, TLS support for pinot connections, and various performance optimizations and improvements.
It also adds several new APIs to better manage the segments and upload data to the offline table. It also contains many key bug fixes. See details below.
The release was cut from the following commit: 78152cd
and the following cherry-picks:
Add a server metric: queriesDisabled to check if queries disabled or not. ()
Optimization on GroupKey to save the overhead of ser/de the group keys () ()
Support validation for jsonExtractKey
Pinot controller metrics prefix is fixed to add a missing dot (). This is a backward-incompatible change that JMX query on controller metrics must be updated
Legacy group key delimiter (\t) was removed to be backward-compatible with release 0.5.0 ()
Upgrade zookeeper version to 3.5.8 to fix ZOOKEEPER-2184: Zookeeper Client should re-resolve hosts when connection attempts fail. ()
Fix the SIGSEGV for large index ()
Handle creation of segments with 0 rows so segment creation does not fail if data source has 0 rows. ()
Fix QueryRunner tool for multiple runs ()
Querying JSON data
To see how JSON data can be queried, assume that we have the following table:
We also assume that "jsoncolumn" has a Json Index on it. Note that the last two rows in the table have different structure than the rest of the rows. In keeping with JSON specification, a JSON column can contain any valid JSON data and doesn't need to adhere to a predefined schema. To pull out the entire JSON document for each row, we can run the query below:
SELECT id, jsoncolumn
FROM myTable
id
jsoncolumn
"101"
To drill down and pull out specific keys within the JSON column, we simply append the JsonPath expression of those keys to the end of the column name.
id
last_name
first_name
value
Note that the third column (value) is null for rows with id 106 and 107. This is because these rows have JSON documents that don't have a key with JsonPath $.data[1]. We can filter out these rows.
id
last_name
first_name
value
Certain last names (duck and mouse for example) repeat in the data above. We can get a count of each last name by running a GROUP BY query on a JsonPath expression.
jsoncolumn.name.last
count(*)
Also there is numerical information (jsconcolumn.$.id) embeded within the JSON document. We can extract those numerical values from JSON data into SQL and sum them up using the query below.
jsoncolumn.name.last
sum(jsoncolumn.score)
Note that the JSON_MATCH function utilizes JsonIndex and can only be used if a JsonIndex is already present on the JSON column. As shown in the examples above, the second argument of JSON_MATCH operator takes a predicate. This predicate is evaluated against the JsonIndex and supports =, !=, IS NULL, or IS NOT NULL operators. Relational operators, such as >, <
jsoncolumn.name.last
sum(jsoncolumn.score)
JSON_MATCH function also provides the ability to use wildcard * JsonPath expressions even though it doesn't support full JsonPath expressions.
last_name
total
While, JSON_MATCH supports IS NULL and IS NOT NULL operators, these operators should only be applied to leaf-level path elements, i.e the predicate JSON_MATCH(jsoncolumn, '"$.data[*]" IS NOT NULL') is not valid since "$.data[*]" does not address a "leaf" element of the path; however, "$.data[0]" IS NOT NULL') is valid since "$.data[0]" unambigously identifies a leaf element of the path.
JSON_EXTRACT_SCALAR does not utilize JsonIndex and therefore performs slower than JSON_MATCH which utilizes JsonIndex. However, JSON_EXTRACT_SCALAR supports a wider range for of JsonPath expressions and operators. To make the best use of fast index access (JSON_MATCH) along with JsonPath expressions (JSON_EXTRACT_SCALAR) you can combine the use of these two functions in WHERE clause.
The second argument of the JSON_MATCH function is a boolean expression in string form. This section shows how to correctly write the second argument of JSON_MATCH. Let's assume we want to search a JSON array array data for values k and j. This can be done by the following predicate:
To convert this predicate into string form for use in JSON_MATCH, we first turn the left side of the predicate into an identifier by enclosing it in double quotes:
Next, the literals in the predicate also need to be enclosed by '. Any existing ' need to be escaped as well. This gives us:
Finally, we need to create a string out of the entire expression above by enclosing it in ':
Now we have the string representation of the original predicate and this can be used in JSON_MATCH function:
Input formats
This section contains a collection of guides that will show you how to import data from a Pinot supported input format.
Pinot offers support for various popular input formats during ingestion. By changing the input format, you can reduce the time spent doing serialization-deserialization and speed up the ingestion.
The input format can be changed using the recordReaderSpec config in the ingestion job spec.
The config consists of the following keys:
dataFormat - Name of the data format to consume.
0.3.0
0.3.0 release of Apache Pinot introduces the concept of plugins that makes it easy to extend and integrate with other systems.
The reason behind the architectural change from the previous release (0.2.0) and this release (0.3.0), is the possibility of extending Apache Pinot. The 0.2.0 release was not flexible enough to support new storage types nor new stream types. Basically, inserting a new functionality required to change too much code. Thus, the Pinot team went through an extensive refactoring and improvement of the source code.
For instance, the picture below shows the module dependencies of the 0.2.X or previous releases. If we wanted to support a new storage type, we would have had to change several modules. Pretty bad, huh?
In order to conquer this challenge, below major changes are made:
Real Time Provisioning Helper tool improvement to take data characteristics as input instead of an actual segment (#6546)
Add the isolation level config isolation.level to Kafka consumer (2.0) to ingest transactionally committed messages only (#6580)
Enhance StarTreeIndexViewer to support multiple trees (#6569)
Improves ADLSGen2PinotFS with service principal based auth, auto create container on initial run. It's backwards compatible with key based auth. (#6531)
Add api for cluster manager to get table state (#6211)
Perf optimization for SQL GROUP BY ORDER BY (#6225)
Add support using environment variables in the format of ${VAR_NAME:DEFAULT_VALUE} in Pinot table configs. (#6271)
Add TLS-support for client-pinot and pinot-internode connections (#6418) Upgrades to a TLS-enabled cluster can be performed safely and without downtime. To achieve a live-upgrade, go through the following steps:
First, configure alternate ingress ports for https/netty-tls on brokers, controllers, and servers. Restart the components with a rolling strategy to avoid cluster downtime.
Second, verify manually that https access to controllers and brokers is live. Then, configure all components to prefer TLS-enabled connections (while still allowing unsecured access). Restart the individual components.
Third, disable insecure connections via configuration. You may also have to set controller.vip.protocol and controller.vip.port and update the configuration files of any ingestion jobs. Restart components a final time and verify that insecure ingress via http is not available anymore.
Apache Pinot has adopted SQL syntax and semantics. Legacy PQL (Pinot Query Language) is deprecated and no longer supported. Please use SQL syntax to query Pinot on broker endpoint /query/sql and controller endpoint /sql
Use URL encoding for the generated segment tar name to handle characters that cannot be parsed to URI. (#6571)
Fix a bug of miscounting the top nodes in StarTreeIndexViewer (#6569)
Fix the raw bytes column in real-time segment (#6574)
Fixes a bug to allow using JSON_MATCH predicate in SQL queries (#6535)
Fix the overflow issue when loading the large dictionary into the buffer (#6476)
SELECT id,
json_extract_scalar(jsoncolumn, '$.name.last', 'STRING', 'null') last_name,
json_extract_scalar(jsoncolumn, '$.name.first', 'STRING', 'null') first_name
json_extract_scalar(jsoncolumn, '$.data[1]', 'STRING', 'null') value
FROM myTable
SELECT id,
json_extract_scalar(jsoncolumn, '$.name.last', 'STRING', 'null') last_name,
json_extract_scalar(jsoncolumn, '$.name.first', 'STRING', 'null') first_name,
json_extract_scalar(jsoncolumn, '$.data[1]', 'STRING', 'null') value
FROM myTable
WHERE JSON_MATCH(jsoncolumn, '"$.data[1]" IS NOT NULL')
SELECT json_extract_scalar(jsoncolumn, '$.name.last', 'STRING', 'null') last_name,
count(*)
FROM myTable
WHERE JSON_MATCH(jsoncolumn, '"$.data[1]" IS NOT NULL')
GROUP BY json_extract_scalar(jsoncolumn, '$.name.last', 'STRING', 'null')
ORDER BY 2 DESC
SELECT json_extract_scalar(jsoncolumn, '$.name.last', 'STRING', 'null') last_name,
sum(json_extract_scalar(jsoncolumn, '$.id', 'INT', 0)) total
FROM myTable
WHERE JSON_MATCH(jsoncolumn, '"$.name.last" IS NOT NULL')
GROUP BY json_extract_scalar(jsoncolumn, '$.name.last', 'STRING', 'null')
SELECT json_extract_scalar(jsoncolumn, '$.name.last', 'STRING', 'null') last_name,
sum(json_extract_scalar(jsoncolumn, '$.id', 'INT', 0)) total
FROM myTable
WHERE JSON_MATCH(jsoncolumn, '"$.name.last" IS NOT NULL') AND json_extract_scalar(jsoncolumn, '$.id', 'INT', 0) > 102
GROUP BY json_extract_scalar(jsoncolumn, '$.name.last', 'STRING', 'null')
SELECT json_extract_scalar(jsoncolumn, '$.name.last', 'STRING', 'null') last_name,
json_extract_scalar(jsoncolumn, '$.id', 'INT', 0) total
FROM myTable
WHERE JSON_MATCH(jsoncolumn, '"$.data[*]" = ''f''')
GROUP BY json_extract_scalar(jsoncolumn, '$.name.last', 'STRING', 'null')
data[0] IN ('k', 'j')
"data[0]" IN ('k', 'j')
"data[0]" IN (''k'', ''j'')
'"data[0]" IN (''k'', ''j'')'
WHERE JSON_MATCH(jsoncolumn, '"data[0]" IN (''k'', ''j'')')
POST /tasks/schedule?taskType=myTask&tableName=myTable_OFFLINE
Schedule tasks for the given task type on the given table
NumMinionSubtasksError: Number of error sub-tasks (completed with an error/exception)
PercentMinionSubtasksInQueue: Percent of sub-tasks in waiting or running states
PercentMinionSubtasksInError: Percent of sub-tasks in error
cronSchedulerJobExecutionTimeMs: Time used to complete task generation, as a Timer.
NUMBER_TASKS_EXECUTED: Number of tasks executed, as a Meter.
NUMBER_TASKS_COMPLETED: Number of tasks completed, as a Meter.
NUMBER_TASKS_CANCELLED: Number of tasks cancelled, as a Meter.
NUMBER_TASKS_FAILED: Number of tasks failed, as a Meter. Different from fatal failure, the task encountered an error which can not be recovered from this run, but it may still succeed by retrying the task.
NUMBER_TASKS_FATAL_FAILED: Number of tasks fatal failed, as a Meter. Different from failure, the task encountered an error, which will not be recoverable even with retrying the task.
Usage: StartMinion
-help : Print this message. (required=false)
-minionHost <String> : Host name for minion. (required=false)
-minionPort <int> : Port number to start the minion at. (required=false)
-zkAddress <http> : HTTP address of Zookeeper. (required=false)
-clusterName <String> : Pinot cluster name. (required=false)
-configFileName <Config File Name> : Minion Starter Config file. (required=false)
public interface PinotTaskGenerator {
/**
* Initializes the task generator.
*/
void init(ClusterInfoAccessor clusterInfoAccessor);
/**
* Returns the task type of the generator.
*/
String getTaskType();
/**
* Generates a list of tasks to schedule based on the given table configs.
*/
List<PinotTaskConfig> generateTasks(List<TableConfig> tableConfigs);
/**
* Returns the timeout in milliseconds for each task, 3600000 (1 hour) by default.
*/
default long getTaskTimeoutMs() {
return JobConfig.DEFAULT_TIMEOUT_PER_TASK;
}
/**
* Returns the maximum number of concurrent tasks allowed per instance, 1 by default.
*/
default int getNumConcurrentTasksPerInstance() {
return JobConfig.DEFAULT_NUM_CONCURRENT_TASKS_PER_INSTANCE;
}
/**
* Performs necessary cleanups (e.g. remove metrics) when the controller leadership changes.
*/
default void nonLeaderCleanUp() {
}
}
public interface PinotTaskExecutorFactory {
/**
* Initializes the task executor factory.
*/
void init(MinionTaskZkMetadataManager zkMetadataManager);
/**
* Returns the task type of the executor.
*/
String getTaskType();
/**
* Creates a new task executor.
*/
PinotTaskExecutor create();
}
public interface PinotTaskExecutor {
/**
* Executes the task based on the given task config and returns the execution result.
*/
Object executeTask(PinotTaskConfig pinotTaskConfig)
throws Exception;
/**
* Tries to cancel the task.
*/
void cancel();
}
public interface MinionEventObserverFactory {
/**
* Initializes the task executor factory.
*/
void init(MinionTaskZkMetadataManager zkMetadataManager);
/**
* Returns the task type of the event observer.
*/
String getTaskType();
/**
* Creates a new task event observer.
*/
MinionEventObserver create();
}
public interface MinionEventObserver {
/**
* Invoked when a minion task starts.
*
* @param pinotTaskConfig Pinot task config
*/
void notifyTaskStart(PinotTaskConfig pinotTaskConfig);
/**
* Invoked when a minion task succeeds.
*
* @param pinotTaskConfig Pinot task config
* @param executionResult Execution result
*/
void notifyTaskSuccess(PinotTaskConfig pinotTaskConfig, @Nullable Object executionResult);
/**
* Invoked when a minion task gets cancelled.
*
* @param pinotTaskConfig Pinot task config
*/
void notifyTaskCancelled(PinotTaskConfig pinotTaskConfig);
/**
* Invoked when a minion task encounters exception.
*
* @param pinotTaskConfig Pinot task config
* @param exception Exception encountered during execution
*/
void notifyTaskError(PinotTaskConfig pinotTaskConfig, Exception exception);
}
Using "POST /cluster/configs" API on CLUSTER tab in Swagger, with this payload
{
"RealtimeToOfflineSegmentsTask.timeoutMs": "600000",
"RealtimeToOfflineSegmentsTask.numConcurrentTasksPerInstance": "4"
}
className - name of the class that implements the RecordReader interface. This class is used for parsing the data.
configClassName - name of the class that implements the RecordReaderConfig interface. This class is used the parse the values mentioned in configs
configs - Key value pair for format specific configs. This field can be left out.
Pinot supports the multiple input formats out of the box. You just need to specify the corresponding readers and the associated custom configs to switch between the formats.
CSV Record Reader supports the following configs -
fileFormat - can be one of default, rfc4180, excel, tdf, mysql
header - header of the file. The columnNames should be seperated by the delimiter mentioned in the config
delimiter - The character seperating the columns
multiValueDelimiter - The character seperating multiple values in a single column. This can be used to split a column into a list.
Supported from 0.11 release -
skipHeader - skip header record in the file. Boolean
ignoreEmptyLines - ignore empty lines instead of consuming them and filling with default values. Boolean
ignoreSurroundingSpaces - ignore spaces around column names and values. Boolean
quoteCharacter - single character that is being used for quotes in CSV files
recordSeparator - character used to seperate records in the input file. Default is \n or \r\n depending on the platform.
nullStringValue - string value the represents null in CSV files. Default is empty string.
The Avro record reader converts the data in file to a GenericRecord. A java class or .avro file is not required. By default the avro record reader only supports primitive types. You can set enableLogicalTypes to true to enable support for rest of the avro data types.
We use the following conversion table to translate between avro and pinot data types. The conversions are done using the offical avro methods present in org.apache.avro.Conversions
Avro Data Type
Pinot Data Type
Comment
INT
INT
LONG
Since 0.11.0 release, The Parquet record reader determines whether to use ParquetAvroRecordReader or ParquetNativeRecordReader to read records. The reader looks for parquet.avro.schema or avro.schema key in the parquet file footer and if present uses the Avro reader.
Users can however change the record reader manually in case of a misconfiguration.
INT96
LONG
ParquetINT96 type converts nanoseconds
to Pinot INT64 type of milliseconds
INT64
LONG
INT32
For ParquetAvroRecordReader , you can refer to the Avro section above for the type conversions.
ORC record reader supports the following data types -
ORC Data Type
Java Data Type
BOOLEAN
String
SHORT
Integer
The reader requires a descriptor file to deserialize the data present in the files. You can generate the descriptor file (.desc) from the .proto file using the command -
Your CSV file may have raw text fields that cannot be reliably delimited using any character. In this case, explicitly set the multiValueDelimeter field to empty in the ingestion config.
multiValueDelimiter: ''
AVRO
JSON
Thrift
Thrift requires the generated class using .thrift file to parse the data. The .class file should be available in the Pinot's classpath. You can put the files in the lib/ folder of pinot distribution directory.
Parquet
For the support of DECIMAL and other parquet native data types, always use ParquetNativeRecordReader
ORC
In LIST and MAP types, the object should only belong to one of the data types supported by Pinot.
Protocol Buffers
Refactored common interfaces to pinot-spi module
Concluded four types of modules:
Pinot input format: How to read records from various data/file formats: e.g. Avro/CSV/JSON/ORC/Parquet/Thrift
Pinot filesystem: How to operate files on various filesystems: e.g. Azure Data Lake/Google Cloud Storage/S3/HDFS
Pinot stream ingestion: How to ingest data stream from various upstream systems, e.g. Kafka/Kinesis/Eventhub
Pinot batch ingestion: How to run Pinot batch ingestion jobs in various frameworks, like Standalone, Hadoop, Spark.
Built shaded jars for each individual plugin
Added support to dynamically load pinot plugins at server startup time
Now the architecture supports a plug-and-play fashion, where new tools can be supported with little and simple extensions, without affecting big chunks of code. Integrations with new streaming services and data formats can be developed in a much more simple and convenient way.
Dependency graph after introducing pinot-plugin in 0.3.0
Support non-literal expressions for right-side operand in predicate comparison()
Added support for DISTINCT ()
Added support default value for BYTES column ()
JDK 11 Support
Added support to tune size vs accuracy for approximation aggregation functions: DistinctCountHLL, PercentileEst, PercentileTDigest ()
Added Data Anonymizer Tool ()
Deprecated pinot-hadoop and pinot-spark modules, replace with pinot-batch-ingestion-hadoop and pinot-batch-ingestion-spark
Support STRING and BYTES for no dictionary columns in realtime consuming segments ()
Make pinot-distribution to build a pinot-all jar and assemble it ()
Added support for PQL case insensitive ()
Enhanced TableRebalancer logics
Moved to new rebalance strategy ()
Supported rebalancing tables under any condition()
Added experimental support for Text Search ()
Upgraded Helix to version 0.9.4, task management now works as expected ()
Added date_trunc transformation function. ()
Support schema evolution for consuming segment. ()
APIs Additions/Changes
Pinot Admin Command
Added -queryType option in PinotAdmin PostQuery
Configurations Additions/Changes
Config: controller.host is now optional in Pinot Controller
Added instance config: queriesDisabled to disable query sending to a running server (
Fixed the bug of releasing the segment when there are still threads working on it. (#4764)
Fixed the bug of uneven task distribution for threads (#4793)
Fixed encryption for .tar.gz segment file upload (#4855)
Fixed controller rest API to download segment from non local FS. ()
Fixed the bug of not releasing segment lock if segment recovery throws exception ()
Fixed the issue of server not registering state model factory before connecting the Helix manager ()
Fixed the exception in server instance when Helix starts a new ZK session ()
Fixed ThreadLocal DocIdSet issue in ExpressionFilterOperator ()
Fixed the bug in default value provider classes ()
Fixed the bug when no segment exists in RealtimeSegmentSelector ()
We are in the process of supporting text search query functionalities.
We are in the process of supporting null value (#4230), currently limited query feature is supported
Added Presence Vector to represent null value (#4585)
Added null predicate support for leaf predicates ()
It’s a disruptive upgrade from version 0.1.0 to this because of the protocol changes between Pinot Broker and Pinot Server. Please ensure that you upgrade to release 0.2.0 first, then upgrade to this version.
If you build your own startable or war without using scripts generated in Pinot-distribution module. For Java 8, an environment variable “plugins.dir” is required for Pinot to find out where to load all the Pinot plugin jars. For Java 11, plugins directory is required to be explicitly set into classpath. Please see pinot-admin.sh as an example.
As always, we recommend that you upgrade controllers first, and then brokers and lastly the servers in order to have zero downtime in production clusters.
Kafka 0.9 is no longer included in the release distribution.
Pull request introduces a backward incompatible API change for segments management.
Removed segment toggle APIs
Removed list all segments in cluster APIs
Pull request deprecated below task related APIs:
GET:
/tasks/taskqueues: List all task queues
Deprecated modules pinot-hadoop and pinot-spark and replaced with pinot-batch-ingestion-hadoop and pinot-batch-ingestion-spark.
Introduced new Pinot batch ingestion jobs and yaml based job specs to define segment generation jobs and segment push jobs.
You may see exceptions like below in pinot-brokers during cluster upgrade, but it's safe to ignore them.
What's the big change?
0.2.0 and before Pinot Module Dependency Diagram
Notable New Features
Major Bug Fixes
Work in Progress
Backward Incompatible Changes
Apache Kafka
This guide shows you how to ingest a stream of records from an Apache Kafka topic into a Pinot table.
Introduction
In this guide, you'll learn how to import data into Pinot using Apache Kafka for real-time stream ingestion. Pinot has out-of-the-box real-time ingestion support for Kafka.
Let's setup a demo Kafka cluster locally, and create a sample topic transcript-topic
Start Kafka
dockerrun\--networkpinot-demo
Create a Kafka Topic
dockerexec\-tkafka
Start Kafka
Start Kafka cluster on port 9092 using the same Zookeeper from the .
Create a Kafka topic
Download the latest . Create a topic.
We will publish the data in the same format as mentioned in the docs. So you can use the same schema mentioned under .
The real-time table configuration for the transcript table described in the schema from the previous step.
For Kafka, we use streamType as kafka . See for available decoder class options. You can also write your own decoder by extending the StreamMessageDecoder interface and putting the jar file in plugins directory.
The lowLevel consumer reads data per partition whereas the highLevel consumer utilises Kafka high level consumer to read data from the whole stream. It doesn't have the control over which partition to read at a particular momemt.
For Kafka versions below 2.X, use org.apache.pinot.plugin.stream.kafka09.KafkaConsumerFactory
For Kafka version 2.X and above, use
org.apache.pinot.plugin.stream.kafka20.KafkaConsumerFactory
You can set the offset to -
smallest to start consumer from the earliest offset
largest to start consumer from the latest offset
timestamp in format yyyy-MM-dd'T'HH:mm:ss.SSSZ
The resulting configuration should look as follows -
Now that we have our table and schema configurations, let's upload them to the Pinot cluster. As soon as the real-time table is created, it will begin ingesting available records from the Kafka topic.
We will publish data in the following format to Kafka. Let us save the data in a file named as transcript.json.
Push sample JSON into the transcript-topic Kafka topic, using the Kafka console producer. This will add 12 records to the topic described in the transcript.json file.
Checkin Kafka docker container
Publish messages to the target topic
As soon as data flows into the stream, the Pinot table will consume it and it will be ready for querying. Head over to the to checkout the real-time data.
Pinot supports 2 major generations of Kafka library - kafka-0.9 and kafka-2.x for both high and low level consumers.
Update table config for both high level and low level consumer: Update config: stream.kafka.consumer.factory.class.name from org.apache.pinot.core.realtime.impl.kafka.KafkaConsumerFactory to org.apache.pinot.core.realtime.impl.kafka2.KafkaConsumerFactory.
If using Stream(High) level consumer: Please also add config stream.kafka.hlc.bootstrap.server into tableIndexConfig.streamConfigs
This connector is also suitable for Kafka lib version higher than 2.0.0. In , change the kafka.lib.version from 2.0.0 to 2.1.1 will make this Connector working with Kafka 2.1.1.
Here is an example config which uses SSL based authentication to talk with kafka and schema-registry. Notice there are two sets of SSL options, ones starting with ssl. are for kafka consumer and ones with stream.kafka.decoder.prop.schema.registry. are for SchemaRegistryClient used by KafkaConfluentSchemaRegistryAvroMessageDecoder.
The connector with Kafka library 2.0+ supports Kafka transactions. The transaction support is controlled by config kafka.isolation.level in Kafka stream config, which can be read_committed or read_uncommitted (default). Setting it to read_committed will ingest transactionally committed messages in Kafka stream only.
For example,
Note that the default value of this config read_uncommitted to read all messages. Also, this config supports low-level consumer only.
Here is an example config which uses SASL_SSL based authentication to talk with kafka and schema-registry. Notice there are two sets of SSL options, some for kafka consumer and ones with stream.kafka.decoder.prop.schema.registry. are for SchemaRegistryClient used by KafkaConfluentSchemaRegistryAvroMessageDecoder.
Pinot's Kafka connector now supports automatically extracting record headers and metadata into the Pinot table columns. The following table shows the mapping for record header/metadata to Pinot table column names:
Kafka Record
Pinot Table Column
Description
In order to enable the metadata extraction in a Kafka table, you can set the stream config metadata.populate to true.
In addition to this, if you want to actually use any of these columns in your table, you have to list them explicitly in your table's schema.
For example, if you want to add only the offset and key as dimension columns in your Pinot table, it can listed in the schema as follows:
Once the schema is updated, these columns are similar to any other pinot column. You can apply ingestion transforms and / or define indexes on them.
Running in Kubernetes
Pinot quick start in Kubernetes
Before continuing, please make sure that you've downloaded Apache Pinot. The scripts for the setup in this guide can be found in our open source project on GitHub.
The scripts can be found in the Pinot source at ./pinot/kubernetes/helm
Pinot repo has pre-packaged HelmCharts for Pinot and Presto. Helm Repo index file is .
NOTE: Please specify StorageClass based on your cloud vendor. For Pinot Server, please don't mount blob store like AzureFile/GoogleCloudStorage/S3 as the data serving file system.
Stream Ingestion with Upsert
Upsert support in Apache Pinot.
Pinot provides native support of upsert during the real-time ingestion (v0.6.0+). There are scenarios that the records need modifications, such as correcting a ride fare and updating a delivery status.
With the foundation of full upsert support in Pinot, another category of use cases on partial upsert are enabled (v0.8.0+). Partial upsert is convenient to users so that they only need to specify the columns whose value changes, and ignore the others.
To enable upsert on a Pinot table, there are a couple of configurations to make on the table configurations as well as on the input stream.
To update a record, a primary key is needed to uniquely identify the record. To define a primary key, add the field primaryKeyColumns to the schema definition. For example, the schema definition of UpsertMeetupRSVP in the quick start example has this definition.
0.8.0
This release introduced several new features, including compatibility tests, enhanced complex type and Json support, partial upsert support, and new stream ingestion plugins.
This release introduced several awesome new features, including compatibility tests, enhanced complex type and Json support, partial upsert support, and new stream ingestion plugins (AWS Kinesis, Apache Pulsar). It contains a lot of query enhancements such as new timestamp and boolean type support and flexible numerical column comparison. It also includes many key bug fixes. See details below.
The release was cut from the following commit: fe83e95aa9124ee59787c580846793ff7456eaa5
and the following cherry-picks:
LONG
FLOAT
FLOAT
DOUBLE
DOUBLE
BOOLEAN
BOOLEAN
STRING
STRING
ENUM
STRING
BYTES
BYTES
FIXED
BYTES
MAP
JSON
ARRAY
JSON
RECORD
JSON
UNION
JSON
DECIMAL
BYTES
UUID
STRING
DATE
STRING
yyyy-MM-dd format
TIME_MILLIS
STRING
HH:mm:ss.SSS format
TIME_MICROS
STRING
HH:mm:ss.SSSSSS format
TIMESTAMP_MILLIS
TIMESTAMP
TIMESTAMP_MICROS
TIMESTAMP
INT
FLOAT
FLOAT
DOUBLE
DOUBLE
BINARY
BYTES
FIXED-LEN-BYTE-ARRAY
BYTES
DECIMAL
DOUBLE
ENUM
STRING
UTF8
STRING
REPEATED
MULTIVALUE/MAP (represented as MV
if parquet original type is LIST, then it is converted to MULTIVALUE column otherwise a MAP column.
INT
Integer
LONG
Integer
FLOAT
Float
DOUBLE
Double
STRING
String
VARCHAR
String
CHAR
String
LIST
Object[]
MAP
Map<Object, Object>
DATE
Long
TIMESTAMP
Long
BINARY
byte[]
BYTE
Integer
Supported reassigning completed segments along with Consuming segments for LLC realtime table (#5015)
subcommand (
)
Added -schemaFile as option in AddTable command (#4959)
Added OperateClusterConfig sub command in PinotAdmin (#5073)
Post release 0.10.0, we have started shading kafka packages inside Pinot. If you are using our latest tagged docker images or master build, you should replace org.apache.kafka with shaded.org.apache.kafka in your table config.
Upgrade from Kafka 0.9 connector to Kafka 2.x connector
How to consume from a Kafka version > 2.0.0?
Kafka Configurations in Pinot
Use Kafka Partition(Low) Level Consumer with SSL
Consume Transactionally-committed Messages
Use Kafka Partition(Low) Level Consumer with SASL_SSL
Error: Please run the below command if encountering the following issue:
Resolution:
Error: Please run the command below if encountering a permission issue:
Error: release pinot failed: namespaces "pinot-quickstart" is forbidden: User "system:serviceaccount:kube-system:default" cannot get resource "namespaces" in API group "" in the namespace "pinot-quickstart"
Ensure the Kafka deployment is ready before executing the scripts in the following next steps.
The scripts below will create two Kafka topics for data ingestion:
The script below will deploy 3 batch jobs.
Ingest 19492 JSON messages to Kafka topic flights-realtime at a speed of 1 msg/sec
Ingest 19492 Avro messages to Kafka topic flights-realtime-avro at a speed of 1 msg/sec
Upload Pinot schema airlineStats
Create Pinot table airlineStats to ingest data from JSON encoded Kafka topic flights-realtime
Create Pinot table airlineStatsAvro to ingest data from Avro encoded Kafka topic flights-realtime-avro
Please use the script below to perform local port-forwarding, which will also open Pinot query console in your default web browser.
This script can be found in the Pinot source at ./pinot/kubernetes/helm/pinot
Install SuperSet Helm Repo
Get Helm values config file:
Edit /tmp/superset-values.yaml file and add pinotdb pip dependency into bootstrapScript field, so Superset will install pinot dependencies during bootstrap time.
You can also build your own image with this dependency or just use image: apachepinot/pinot-superset:latest instead.
Also remember to change the admin credential inside the init section with meaningful user profile and stronger password.
Install Superset using helm
Ensure your cluster is up by running:
You can run the below command to port forward superset to your localhost:18088. Then you can navigate superset in your browser with the previous set admin credential.
Once the database is added, you can add more data sets and explore the dashboarding.
You can run the command below to deploy Trino with the Pinot plugin installed.
The above command adds Trino HelmChart repo. You can then run the below command to see the charts.
In order to connect Trino to Pinot, we need to add Pinot catalog, which requires extra configurations. You can run the below command to get all the configurable values.
To add Pinot catalog, you can edit the additionalCatalogs section by adding:
After modifying the /tmp/trino-values.yaml file, you can deploy Trino with:
Once you deployed the Trino, You can check Trino deployment status by:
Once Trino is deployed, you can run the below command to get a runnable Trino CLI.
6.2.2 Port forward Trino service to your local if it's not already exposed
6.2.3 Use Trino console client to connect to Trino service
6.2.4 Query Pinot data using Trino CLI
List all catalogs
List All tables
Show schema
Count total documents
You can run the command below to deploy a customized Presto with the Pinot plugin installed.
The above command deploys Presto with default configs. For customizing your deployment, you can run the below command to get all the configurable values.
After modifying the /tmp/presto-values.yaml file, you can deploy Presto with:
Once you deployed the Presto, You can check Presto deployment status by:
Sample Output of K8s Deployment Status
Once Presto is deployed, you can run the below command from here, or just follow steps 6.2.1 to 6.2.3.
6.2.2 Port forward presto-coordinator port 8080 to localhost port 18080
6.2.4 Query Pinot data using Presto CLI
List all catalogs
List All tables
Show schema
Count total documents
Note: These are sample configs to be used as reference. For production setup, you may want to customize it to your needs.
1. Prerequisites
This quickstart assumes that you already have a running Kubernetes cluster. Please follow the links below to set up a Kubernetes cluster.
3.1 Bring up a Kafka cluster for real-time data ingestion
3.2 Check Kafka deployment status
3.3 Create Kafka topics
3.4 Load data into Kafka and create Pinot schema/tables
4. Query using Pinot Data Explorer
4.1 Pinot Data Explorer
5. Using Superset to query Pinot
5.1 Bring up Superset using helm
5.2 Access Superset UI
6. Access Pinot using Trino
6.1 Deploy Trino
Pinot is deployed at namespace pinot-quickstart, so the controller serviceURL is pinot-controller.pinot-quickstart:9000
6.2 Query Trino using Trino CLI
6.2.1 Download Trino CLI
6.3 Sample queries to execute
7. Access Pinot using Presto
7.1 Deploy Presto using Pinot plugin
7.2 Query Presto using Presto CLI
6.2.1 Download Presto CLI
6.2.3 Start Presto CLI with pinot catalog to query it then query it
7.3 Sample queries to execute
8. Deleting the Pinot cluster in Kubernetes
Note this field expects a list of columns, as the primary key can be composite.
When two records of the same primary key are ingested, the record with the greater comparison value (timeColumn by default) is used. When records with the same primary key and event time, then the order is not determined. In most cases, the later ingested record will be used, but may not be so in the cases when the table has a column to sort by.
There are a few configurations needed in the table configurations to enable upsert.
Full upsert
The upsert mode defaults to NONE for realtime tables. To enable the full upsert, set the mode to FULL for the full update. FULL upsert means that a new record will replace the older record completely if they have same primary key. Example config:
Partial upserts
Partial upsert support is also added in release-0.8.0. With this feature, users can choose to update only specific columns and ignore the rest.
To enable the partial upsert, set the mode to PARTIAL and specify partialUpsertStrategies for partial upsert columns. Since release-0.10.0, OVERWRITE is used as the default strategy for columns without a specified strategy. defaultPartialUpsertStrategy is also introduced to change the default strategy for all columns. For example:
Pinot supports the following partial upsert strategies:
Strategy
Description
OVERWRITE
Overwrite the column of the last record
INCREMENT
Add the new value to the existing values
APPEND
By default, Pinot uses the value in the time column (timeColumn in tableConfig) to determine the latest record. That means, for two records with the same primary key, the record with the larger value of the time column is picked as the latest update. However, there are cases when users need to use another column to determine the order. In such case, you can use option comparisonColumn to override the column used for comparison. For example,
For partial upsert table, the out-of-order events won't be consumed and indexed. For example, for two records with the same primary key, if the record with the smaller value of the comparison column came later than the other record, it will be skipped.
In some cases, especially where partial upsert might be employed, there may be multiple producers of data each writing to a mutually exclusive set of columns, sharing only the primary key. In such a case, it may be helpful to use one comparison column per producer group so that each group can manage its own specific versioning semantics without the need to coordinate versioning across other producer groups.
Documents written to Pinot are expected to have exactly 1 non-null value out of the set of comparisonColumns; if more than 1 of the columns contains a value, the document will be rejected. When new documents are written, whichever comparison column is non-null will be compared against only that same comparison column seen in prior documents with the same primary key. Consider the following examples, where the documents are assumed to arrive in the order specified in the array.
The following would occur:
orderReceived: 1
Result: persisted
Reason: first doc seen for primary key "aa"
orderReceived: 2
Result: persisted (replacing orderReceived: 1)
Reason: comparison column (secondsSinceEpoch) larger than that previously seen
orderReceived: 3
Result: rejected
Reason: comparison column (secondsSinceEpoch) smaller than that previously seen
orderReceived: 4
Result: persisted (replacing orderReceived: 2)
Reason: comparison column (otherComparisonColumn) larger than previously seen (never seen previously), despite the value being smaller than that seen for secondsSinceEpoch
orderReceived: 5
Result: rejected
Reason: comparison column (otherComparisonColumn) smaller than that previously seen
orderReceived: 6
Result: persist (replacing orderReceived: 4)
Reason: comparison column (otherComparisonColumn) larger than that previously seen
The upsert Pinot table can use only the low-level consumer for the input streams. As a result, it uses the partitioned replica-group assignment for the segments. Moreover, upsert poses the additional requirement that all segments of the same partition must be served from the same server to ensure the data consistency across the segments. Accordingly, it requires to use strictReplicaGroup as the routing strategy. To use that, configure instanceSelectorType in Routing as the following:
Upsert snapshot support is also added in release-0.12.0. To enable the snapshot, set the enableSnapshot to true. For example:
Upsert maintains metadata in memory containing which docIds are valid in a particular segment (ValidDocIndexes). This metadata gets lost during server restarts and needs to be recreated again.
ValidDocIndexes can not be recovered easily after out-of-TTL primary keys get removed. Enabling snapshots addresses this problem by adding functions to store and recover validDocIds snapshot for Immutable Segments
We recommend that you enable this feature so as to speed up server boot times during restarts.
There are some limitations for the upsert Pinot tables.
The high-level consumer is not allowed for the input stream ingestion, which means stream.[consumerName].consumer.type must always be lowLevel.
The star-tree index cannot be used for indexing, as the star-tree index performs pre-aggregation during the ingestion.
Unlike append-only tables, out-of-order events (with comparison value in incoming record less than the latest available value) won't be consumed and indexed by Pinot partial upsert table, these late events will be skipped.
Unlike other real-time tables, Upsert table takes up more memory resources as it needs to bookkeep the record locations in memory. As a result, it's important to plan the capacity beforehand, and monitor the resource usage. Here are some recommended practices of using Upsert table.
The number of partitions in input streams determines the partition numbers of the Pinot table. The more partitions you have in input topic/stream, more Pinot servers you can distribute the Pinot table to and therefore more you can scale the table horizontally. Do note that you can't increase the partitions in future for upsert enabled tables so you need to start with good enough partitions (atleast 2-3X the number of pinot servers)
Upsert table maintains an in-memory map from the primary key to the record location. So it's recommended to use a simple primary key type and avoid composite primary keys to save the memory cost. In addition, consider the hashFunction config in the Upsert config, which can be MD5 or MURMUR3, to store the 128-bit hashcode of the primary key instead. This is useful when your primary key takes more space. But keep in mind, this hash may introduce collisions, though the chance is very low.
Set up a dashboard over the metric pinot.server.upsertPrimaryKeysCount.tableName to watch the number of primary keys in a table partition. It's useful for tracking its growth which is proportional to the memory usage growth. **** The total memory usage by upsert is roughly (primaryKeysCount * (sizeOfKeyInBytes + 24))
It's useful to plan the capacity beforehand to ensure you will not run into resource constraints later. A simple way is to measure the rate of the primary keys in the input stream per partition and extrapolate the data to a specific time period (based on table retention) to approximate the memory usage. A heap dump is also useful to check the memory usage so far on an upsert table instance.
Putting these together, you can find the table configurations of the quick start example as the following:
To illustrate how the full upsert works, the Pinot binary comes with a quick start example. Use the following command to creates a realtime upsert table meetupRSVP.
You can also run partial upsert demo with the following command
As soon as data flows into the stream, the Pinot table will consume it and it will be ready for querying. Head over to the Query Console to checkout the realtime data.
Query the upsert table
For partial upsert you can see only the value from configured column changed based on specified partial upsert strategy.
Query the partial upsert table
An example for partial upsert is shown below, each of the event_id kept being unique during ingestion, meanwhile the value of rsvp_count incremented.
Explain partial upsert table
To see the difference from the non-upsert table, you can use a query option skipUpsert to skip the upsert effect in the query result.
Disable the upsert during query via query option
Can I change primary key columns in existing upsert table?
Yes, you can add or delete columns to primary keys as long as input stream is partitioned on one of the primary key columns. However, you need to restart all Pinot servers so that it can rebuild the primary key to record location map with the new columns.
# stop previous quick start cluster, if any
bin/quick-start-upsert-streaming.sh
# stop previous quick start cluster, if any
bin/quick-start-partial-upsert-streaming.sh
Partition the input stream by the primary key
An important requirement for the Pinot upsert table is to partition the input stream by the primary key. For Kafka messages, this means the producer shall set the key in the API. If the original stream is not partitioned, then a streaming processing job (e.g. Flink) is needed to shuffle and repartition the input stream into a partitioned one for Pinot's ingestion.
Enable upsert in the table configurations
Upsert modes
With partial upsert, if the value is null in either the existing record or the new coming record, Pinot will ignore the upsert strategy and the null value:
(null, newValue) -> newValue
(oldValue, null
Comparison column
Multiple Comparison columns
Use strictReplicaGroup for routing
Enable validDocIds snapshots for upsert metadata recovery
The lifecycle for validDocIds snapshots are shows as follows,
If snapshot is enabled, load validDocIds from snapshot during add segments.
If snapshot is not enabled, delete validDocIds snapshots during add segments if exists.
Upsert table Limitations
Best practices
Create the topic/stream with more partitions.
Memory Usage
Monitoring
Capacity planning
Example
Pinot server maintains a primary key to record location map across all the segments served in an upsert-enabled table. As a result, when updating the config for an existing upsert table (e.g. change the columns in the primary key, change the comparison column), servers need to be restarted in order to apply the changes and rebuild the map.
Prefetch call to fetch buffers of columns seen in the query ()
Enabling compatibility tests in the script ()
Add collectionToJsonMode to schema inference ()
Add the complex-type support to decoder/reader ()
Adding a new Controller API to retrieve ingestion status for realtime… ()
Add support for Long in Modulo partition function. ()
Enhance PinotSegmentRecordReader to preserve null values ()
add complex-type support to avro-to-pinot schema inference ()
Add correct yaml files for real time data(#6787) ()
Add complex-type transformation to offline segment creation ()
Add config File support(#6787) ()
Enhance JSON index to support nested array ()
Add debug endpoint for tables. ()
JSON column datatype support. ()
Allow empty string in MV column ()
Add Zstandard compression support with JMH benchmarking(#6804) ()
Normalize LHS and RHS numerical types for = and != operator. ()
Change ConcatCollector implementation to use off-heap ()
[PQL Deprecation] Clean up the old BrokerRequestOptimizer ()
[PQL Deprecation] Do not compile PQL broker request for SQL query ()
Add TIMESTAMP and BOOLEAN data type support ()
Add admin endpoint for Pinot Minon. ()
Remove the usage of PQL compiler ()
Add endpoints in Pinot Controller, Broker and Server to get system and application configs. ()
Support IN predicate in ColumnValue SegmentPruner(#6756) ()
Enable adding new segments to a upsert-enabled realtime table ()
Interface changes for Kinesis connector ()
Pinot Minion SegmentGenerationAndPush task: PinotFS configs inside taskSpec is always temporary and has higher priority than default PinotFS created by the minion server configs ()
DataTable V3 implementation and measure data table serialization cost on server ()
add uploadLLCSegment endpoint in TableResource ()
File-based SegmentWriter implementation ()
Basic Auth for pinot-controller ()
UI integration with Authentication API and added login page ()
Support data ingestion for offline segment in one pass ()
SumPrecision: support all data types and star-tree ()
complete compatibility regression testing ()
Kinesis implementation Part 1: Rename partitionId to partitionGroupId ()
Make Pinot metrics pluggable ()
Recover the segment from controller when LLC table cannot load it ()
Adding a new API for validating specified TableConfig and Schema ()
Introduce a metric for query/response size on broker. ()
Adding a controller periodic task to clean up dead minion instances ()
Adding new validation for Json, TEXT indexing ()
Always return a response from query execution. ()
After the 0.8.0 release, we will officially support jdk 11, and can now safely start to use jdk 11 features. Code is still compilable with jdk 8 (#6424)
RealtimeToOfflineSegmentsTask config has some backward incompatible changes (#7158)
— timeColumnTransformFunction is removed (backward-incompatible, but rollup is not supported anyway)
— Deprecate collectorType and replace it with mergeType
— Add roundBucketTimePeriod and partitionBucketTimePeriod to config the time bucket for round and partition
Regex path for pluggable MinionEventObserverFactory is changed from org.apache.pinot.*.event.* to org.apache.pinot.*.plugin.minion.tasks.* ()
Moved all pinot built-in minion tasks to the pinot-minion-builtin-tasks module and package them into a shaded jar ()
Reloading consuming segment flag pinot.server.instance.reload.consumingSegment will be true by default ()
Move JSON decoder from pinot-kafka to pinot-json package. ()
Backward incompatible schema change through controller rest API PUT /schemas/{schemaName} will be blocked. ()
Deprecated /tables/validateTableAndSchema in favor of the new configs/validate API and introduced new APIs for /tableConfigs to operate on the realtime table config, offline table config and schema in one shot. ()
Fix race condition in MinionInstancesCleanupTask (#7122)
Fix custom instance id for controller/broker/minion (#7127)
Fix the memory issue for selection query with large limit ()
Fix the deleted segments directory not exist warning ()
Fixing docker build scripts by providing JDK_VERSION as parameter ()
Misc fixes for json data type ()
Fix handling of date time columns in query recommender(#7018) ()
fixing pinot-hadoop and pinot-spark test ()
Fixing HadoopPinotFS listFiles method to always contain scheme ()
fixed GenericRow compare for different _fieldToValueMap size ()
Fix NPE in NumericalFilterOptimizer due to IS NULL and IS NOT NULL operator. ()
Fix the race condition in realtime text index refresh thread (#6858) ()
Fix deep store directory structure ()
Fix NPE issue when consumed kafka message is null or the record value is null. ()
Mitigate calcite NPE bug. ()
Fix the exception thrown in the case that a specified table name does not exist (#6328) ()
Fix CAST transform function for chained transforms ()
Fixed failing pinot-controller npm build ()
Summary
Notable New Features
Special notes
Major Bug fixes
JSON Index
JSON index can be applied to JSON string columns to accelerate the value lookup and filtering for the column.
When to use JSON index
JSON string can be used to represent the array, map, nested field without forcing a fixed schema. It is very flexible, but the flexibility comes with a cost - filtering on JSON string columns is very expensive.
Suppose we have some JSON records similar to the following sample record stored in the person column:
Without an index, in order to look up a key and filter records based on the value, we need to scan and reconstruct the JSON object from the JSON string for every record, look up the key and then compare the value.
For example, in order to find all persons whose name is "adam", the query will look like:
SELECT *
FROM mytable
WHERE JSON_EXTRACT_SCALAR(person, '$.name', 'STRING') = 'adam'
JSON index is designed to accelerate the filtering on JSON string columns without scanning and reconstructing all the JSON objects.
To enable the JSON index, set the following config in the table config:
Config Key
Desciprtion
Type
Default
With the following JSON document:
With the default setting, we will flatten the document into the following records:
With maxLevels set to 1:
With maxLevels set to 2:
With excludeArray set to true:
With disableCrossArrayUnnest set to true:
With includePaths set to ["$.name", "$.addresses[*].country"]:
With excludePaths set to ["$.age", "$.addresses[*].number"]:
With excludeFields set to ["age", "street"]:
The legacy config has the same behavior as the default settings in the new config.
Note that JSON index can only be applied to STRING/JSON columns whose values are JSON strings.
JSON index can be used via the JSON_MATCH predicate: JSON_MATCH(<column>, '<filterExpression>'). For example, to find all persons whose name is "adam", the query will look like:
Note that the quotes within the filter expression need to be escaped.
Find all persons whose name is "adam":
Find all persons who have an address (one of the addresses) with number 112:
Find all persons whose name is "adam" and also have an address (one of the addresses) with number 112:
Find all persons whose first address has number 112:
Find all persons who have a phone field within the JSON:
Find all persons whose first address does not contain floor field within the JSON:
The JSON context is maintained for object elements within an array, i.e. the filter won't cross-match different objects in the array.
To find all persons who live on "main st" in "ca":
This query won't match "adam" because none of his addresses matches both the street and the country.
If JSON context is not desired, use multiple separate JSON_MATCH predicates. E.g. to find all persons who have addresses on "main st" and have addressed in "ca" (doesn't have to be the same address):
This query will match "adam" because one of his addresses matches the street and another one matches the country.
Note that the array index is maintained as a separate entry within the element, so in order to query different elements within an array, multiple JSON_MATCH predicates are required. E.g. to find all persons who have first address on "main st" and second address on "second st":
See examples above.
To find the records with array element "item1" in "arrayCol":
To find the records with second array element "item2" in "arrayCol":
To find the records with value 123 in "valueCol":
To find the records with null in "nullableCol":
The key (left-hand side) of the filter expression must be the leaf level of the JSON object, e.g. "$.addresses[*]"='main st' won't work.
Aggregation Functions
Function
Description
Example
Default Value When No Record Selected
Returns the count of the records as Long
COUNT(*)
Deprecated functions:
Function
Description
Example
The following aggregation functions can be used for multi-value columns
Function
Pinot supports FILTER clause in aggregation queries as follows:
In the query above, COL1 is aggregated only for rows where COL2 > 300 and COL3 > 50 . Similarly, COL2 is aggregated where COL2 < 50 and COL3 > 50.
With enabled, this allows to filter out the null values while performing aggregation as follows:
In the above query, COL1 is aggregated only for the non-null values. Without NULL value support, we would have to filter using the default null value.
NOTE: TheFILTER clause is currently supported for aggregation-only queries, i.e., GROUP BY
Whether to exclude array when flattening the object
boolean
false (include array)
disableCrossArrayUnnest
Whether to not unnest multiple arrays (unique combination of all elements)
boolean
false (calculate unique combination of all elements)
includePaths
Only include the given paths, e.g. "$.a.b", "$.a.c[*]" (mutual exclusive with excludePaths). Paths under the included paths will be included, e.g. "$.a.b.c" will be included when "$.a.b" is configured to be included.
Set<String>
null (include all paths)
excludePaths
Exclude the given paths, e.g. "$.a.b", "$.a.c[*]" (mutual exclusive with includePaths). Paths under the excluded paths will also be excluded, e.g. "$.a.b.c" will be excluded when "$.a.b" is configured to be excluded.
Set<String>
null (include all paths)
excludeFields
Exclude the given fields, e.g. "b", "c", even if it is under the included paths.
Set<String>
null (include all fields)
maxLevels
Max levels to flatten the json object (array is also counted as one level)
int
-1 (unlimited)
Configure JSON index
Config since release 0.12.0:
Example:
Legacy config before release 0.12.0:
When you're using a JSON index, we would recommend that you add the indexed column to the noDictionaryColumns columns list to reduce unnecessary storage overhead.
SELECT ...
FROM mytable
WHERE JSON_MATCH(person, '"$.name"=''adam''')
SELECT ...
FROM mytable
WHERE JSON_MATCH(person, '"$.name"=''adam''')
SELECT ...
FROM mytable
WHERE JSON_MATCH(person, '"$.addresses[*].number"=112')
SELECT ...
FROM mytable
WHERE JSON_MATCH(person, '"$.name"=''adam'' AND "$.addresses[*].number"=112')
SELECT ...
FROM mytable
WHERE JSON_MATCH(person, '"$.addresses[0].number"=112')
SELECT ...
FROM mytable
WHERE JSON_MATCH(person, '"$.phone" IS NOT NULL')
SELECT ...
FROM mytable
WHERE JSON_MATCH(person, '"$.addresses[0].floor" IS NULL')
SELECT ...
FROM mytable
WHERE JSON_MATCH(person, '"$.addresses[*].street"=''main st'' AND "$.addresses[*].country"=''ca''')
SELECT ...
FROM mytable
WHERE JSON_MATCH(person, '"$.addresses[*].street"=''main st''') AND JSON_MATCH(person, '"$.addresses[*].country"=''ca''')
SELECT ...
FROM mytable
WHERE JSON_MATCH(person, '"$.addresses[0].street"=''main st''') AND JSON_MATCH(person, '"$.addresses[1].street"=''second st''')
["item1", "item2", "item3"]
SELECT ...
FROM mytable
WHERE JSON_MATCH(arrayCol, '"$[*]"=''item1''')
SELECT ...
FROM mytable
WHERE JSON_MATCH(arrayCol, '"$[1]"=''item2''')
123
1.23
"Hello World"
SELECT ...
FROM mytable
WHERE JSON_MATCH(valueCol, '"$"=123')
null
SELECT ...
FROM mytable
WHERE JSON_MATCH(nullableCol, '"$" IS NULL')
Returns the max - min value for a numeric multi-value column as Double
Returns the Nth percentile of the values for a numeric multi-value column as Double
Returns the Nth percentile using as Long
Returns the Nth percentile using as Double
Returns the count of distinct values for a multi-value column as Integer
Returns the count of distinct values for a multi-value column as Integer. This function is accurate for INT or dictionary encoded column, but approximate for other cases where hash codes are used in distinct counting and there may be hash collision.
Returns an approximate distinct count using HyperLogLog as Long
Returns HyperLogLog response serialized as string. The serialized HLL can be converted back into an HLL and then aggregated with other HLLs. A common use case may be to merge HLL responses from different Pinot tables, or to allow aggregation after client-side batching.
Returns the most frequent value of a numeric column as Double. When multiple modes are present it gives the minimum of all the modes. This behavior can be overridden to get the maximum or the average mode.
Returns the Nth percentile of the values for a numeric column using T-digest as Double
PERCENTILETDIGEST(playerScore, 50)
PERCENTILETDIGEST(playerScore, 99.9)
Double.NaN
PERCENTILESMARTTDIGEST
Returns the Nth percentile of the values for a numeric column as Double. When there are too many values, automatically switch to approximate percentile using TDigest. The switch threshold (100_000 by default) and compression (100 by default) for the TDigest can be configured via the optional second argument.
Returns the count of distinct values of a column as Integer. This function is accurate for INT column, but approximate for other cases where hash codes are used in distinct counting and there may be hash collisions.
Returns HyperLogLog response serialized as String. The serialized HLL can be converted back into an HLL and then aggregated with other HLLs. A common use case may be to merge HLL responses from different Pinot tables, or to allow aggregation after client-side batching.
DISTINCTCOUNTRAWHLL(playerName)
0
DISTINCTCOUNTSMARTHLL
Returns the count of distinct values of a column as Integer. When there are too many distinct values, automatically switch to approximate distinct count using HyperLogLog. The switch threshold (100_000 by default) and log2m (12 by default) for the HyperLogLog can be configured via the optional second argument.
Returns the count of distinct values of a column as Long when the column is pre-partitioned for each segment, where there is no common value within different segments. This function calculates the exact count of distinct values within the segment, then simply sums up the results from different segments to get the final result.
SEGMENTPARTITIONEDDISTINCTCOUNT(playerName)
0
LASTWITHTIME(dataColumn, timeColumn, 'dataType')
Get the last value of dataColumn where the timeColumn is used to define the time of dataColumn and the dataType specifies the type of dataColumn, which can be BOOLEAN, INT, LONG, FLOAT, DOUBLE, STRING
Get the first value of dataColumn where the timeColumn is used to define the time of dataColumn and the dataType specifies the type of dataColumn, which can be BOOLEAN, INT, LONG, FLOAT, DOUBLE, STRING
FASTHLL stores serialized HyperLogLog in String format, which performs worse than DISTINCTCOUNTHLL, which supports serialized HyperLogLog in BYTES (byte array) format
FASTHLL(playerName)
COUNTMV
Returns the count of a multi-value column as Long
MINMV
Returns the minimum value of a numeric multi-value column as Double
MAXMV
Returns the maximum value of a numeric multi-value column as Double
SUMMV
Returns the sum of the values for a numeric multi-value column as Double
SELECT SUM(COL1) FILTER (WHERE COL2 > 300),
AVG(COL2) FILTER (WHERE COL2 < 50)
FROM MyTable WHERE COL3 > 50
SELECT SUM(COL1) FILTER (WHERE COL1 IS NOT NULL)
FROM MyTable WHERE COL3 > 50
FASTHLLMV (Deprecated)
stores serialized HyperLogLog in String format, which performs worse than DISTINCTCOUNTHLL, which supports serialized HyperLogLog in BYTES (byte array) format
This document contains the list of all the transformation functions supported by Pinot SQL.
Math Functions
Function
Sum of at least two values
Difference between two values
Product of at least two values
Multiple string functions are supported out of the box from release-0.5.0 .
Function
Date time functions allow you to perform transformations on columns that contain timestamps or dates.
Function
These functions can only be used in Pinot SQL queries.
Function
These functions can be used for column transformation in table ingestion configs.
Function
Function
All of the functions mentioned till now only support single value columns. You can use the following functions to do operations on multi-value columns.
Function
Pinot supports Geospatial queries on columns containing text-based geographies. For more details on the queries and how to enable them, see .
Pinot supports pattern matching on text-based columns. Only the columns mentioned as text columns in table config can be queried using this method. For more details on how to enable pattern matching, see .
Find Nth instance of find string in input. Returns 0 if input string is empty. Returns -1 if the Nth instance is not found or input string is null.
returns true if columns starts with prefix string.
replace all instances of find with replace in input
string padded from the right side with pad to reach final size
string padded from the left side with pad to reach final size
the Unicode codepoint of the first character of the string
the character corresponding to the Unicode codepoint
Extracts values that match the provided regular expression
Find and replace a string or regexp pattern with a target string or regexp pattern
removes all instances of search from string
url-encode a string with UTF-8 format
decode a url to plaintext string
decode a Base64-encoded string to bytes represented as a hex string
decode a UTF8-encoded string to bytes represented as a hex string
checks if ipAddress is in the subnet of the ipPrefix
Convert epoch milliseconds to epoch <Time Unit>, and divided by bucket size(Bucket size is defined in <Time Unit>).
Convert epoch <Time Unit> to epoch milliseconds.
Convert epoch <Bucket Size><Time Unit> to epoch milliseconds.
Convert epoch millis value to DateTime string represented by pattern.
Convert DateTime string represented by pattern to epoch millis.
Round the given time value to nearest bucket start value.
Return current time as epoch millis
Return time as epoch millis before the given period (in ISO-8601 duration format)
Returns the hour of the time zone offset.
Returns the minute of the time zone offset.
Returns the year from the given epoch millis in UTC timezone.
Returns the year from the given epoch millis and timezone id.
Returns the year of the ISO week from the given epoch millis in UTC timezone. Alias yowis also supported.
Returns the year of the ISO week from the given epoch millis and timezone id. Alias yowis also supported.
Returns the quarter of the year from the given epoch millis in UTC timezone. The value ranges from 1 to 4.
Returns the quarter of the year from the given epoch millis and timezone id. The value ranges from 1 to 4.
Returns the month of the year from the given epoch millis in UTC timezone. The value ranges from 1 to 12.
Returns the month of the year from the given epoch millis and timezone id. The value ranges from 1 to 12.
Returns the ISO week of the year from the given epoch millis in UTC timezone. The value ranges from 1 to 53. Alias weekOfYear is also supported.
Returns the ISO week of the year from the given epoch millis and timezone id. The value ranges from 1 to 53. Alias weekOfYear is also supported.
Returns the day of the year from the given epoch millis in UTC timezone. The value ranges from 1 to 366. Alias doy is also supported.
Returns the day of the year from the given epoch millis and timezone id. The value ranges from 1 to 366. Alias doy is also supported.
Returns the day of the month from the given epoch millis in UTC timezone. The value ranges from 1 to 31. Alias dayOfMonth is also supported.
Returns the day of the month from the given epoch millis and timezone id. The value ranges from 1 to 31. Alias dayOfMonth is also supported.
Returns the day of the week from the given epoch millis in UTC timezone. The value ranges from 1(Monday) to 7(Sunday). Alias dow is also supported.
Returns the day of the week from the given epoch millis and timezone id. The value ranges from 1(Monday) to 7(Sunday). Alias dow is also supported.
Returns the hour of the day from the given epoch millis in UTC timezone. The value ranges from 0 to 23.
Returns the hour of the day from the given epoch millis and timezone id. The value ranges from 0 to 23.
Returns the minute of the hour from the given epoch millis in UTC timezone. The value ranges from 0 to 59.
Returns the minute of the hour from the given epoch millis and timezone id. The value ranges from 0 to 59.
Returns the second of the minute from the given epoch millis in UTC timezone. The value ranges from 0 to 59.
Returns the second of the minute from the given epoch millis and timezone id. The value ranges from 0 to 59.
Returns the millisecond of the second from the given epoch millis in UTC timezone. The value ranges from 0 to 999.
Returns the millisecond of the second from the given epoch millis and timezone id. The value ranges from 0 to 999.
Extracts the String value from jsonField based on 'jsonPath', use optional defaultValuefor null or parsing error.
Extracts an array from jsonField based on 'jsonPath', the result type is inferred based on JSON value. Cannot be used in query because data type is not specified.
Extracts an array from jsonField based on 'jsonPath', the result type is inferred based on JSON value. Returns empty array for null or parsing error. Cannot be used in query because data type is not specified.
Return the UTF8-encoded string of binary column(bytes type)
SUBSTR(col, startIndex, endIndex)
Gets substring of the input string from start to endIndex. Index begins at 0. Set endIndex to -1 to calculate till end of the string
EXTRACT(dateTimeField FROM dateTimeExpression)
Extracts the field from the DATETIME expression of the format 'YYYY-MM-DD HH:MM:SS'. Currently this transformation function supports YEAR, MONTH, DAY, HOUR, MINUTE, and SECOND fields.
JSONPATH(jsonField, 'jsonPath')
Extracts the object value from jsonField based on 'jsonPath', the result type is inferred based on JSON value. Cannot be used in query because data type is not specified.
MAP_VALUE
Select the value for a key from Map stored in Pinot.
MAP_VALUE(mapColumn, 'myKey', valueColumn)
VALUEIN
The transform function will filter the value from the multi-valued column with the given constant values. The VALUEIN transform function is especially useful when the same multi-valued column is both filtering column and grouping column.
Convert epoch milliseconds to epoch <Time Unit>, round to nearest rounding bucket(Bucket size is defined in <Time Unit>).
Extracts the Double value from jsonField based on 'jsonPath', use optional defaultValuefor null or parsing error.
Return the Base64-encoded string of binary column(bytes type)
Stream ingestion
Apache Pinot lets users consume data from streams and push it directly into the database, in a process known as stream ingestion. Stream Ingestion makes it possible to query data within seconds of publication.
Stream Ingestion provides support for checkpoints for preventing data loss.
Setting up Stream ingestion involves the following steps:
Create schema configuration
Create table configuration
Upload table and schema spec
Let's take a look at each of the steps in more detail.
Let us assume the data to be ingested is in the following format:
Schema defines the fields along with their data types. The schema also defines whether fields serve as dimensions , metrics or timestamp. For more details on schema configuration, see .
For our sample data, the schema configuration looks like this:
The next step is to create a table where all the ingested data will flow and can be queried. Unlike batch ingestion, table configuration for real-time ingestion also triggers the data ingestion job. For a more detailed overview of tables, see the reference.
The real-time table configuration consists of the following fields:
tableName - The name of the table where the data should flow
tableType - The internal type for the table. Should always be set to REALTIME for realtime ingestion
segmentsConfig -
Config key
Description
Supported values
The following flush threshold settings are also supported:
Config key
Description
Supported values
You can also specify additional configs for the consumer directly into the streamConfigs.
For our sample data and schema, the table config will look like this:
Now that we have our table and schema configurations, let's upload them to the Pinot cluster. As soon as the configs are uploaded, pinot will start ingesting available records from the topic.
There are some scenarios where the message rate in the input stream has a bursty nature which can lead to long GC pauses on the Pinot servers or affect the ingestion rate of other realtime tables on the same server. In such scenarios, you should throttle the consumption rate during stream ingestion.
Stream consumption throttling can be tuned using the stream config topic.consumption.rate.limit which indicates the upper bound on the message rate for the entire topic.
Here is the sample configuration on how to configure the consumption throttling:
Some things to keep in mind while tuning this config are:
Since this config applied to the entire topic, internally, this rate is divided by the number of partitions in the topic and applied to each partition's consumer.
In case of multi-tenant deployment (where you have more than 1 table in the same server instance), you need to make sure that the rate limit on one table doesn't step on/starve the rate limiting of another table. So, when there is more than 1 table on the same server (which is most likely to happen), you may need to re-tune the throttling threshold for all the streaming tables.
Once throttling is enabled for a table, you can verify by searching for a log that looks similar to:
In addition, you can monitor the consumption rate utilization with the metric COSUMPTION_QUOTA_UTILIZATION.
Note that any configuration change for topic.consumption.rate.limit in the stream config will NOT take effect immediately. The new configuration will be picked up from the next consuming segment. In order to enforce the new configuration, you need to trigger forceCommit APIs. Please refer to for more details.
We are working on support for other ingestion platforms, but you can also write your own ingestion plugin if it is not supported out of the box. For a walkthrough, see .
There are some scenarios in which you may want to pause the realtime ingestion while your table is available for queries. For example if there is a problem with the stream ingestion, while you are troubleshooting the issue, you still want the queries to be executed on the already ingested data. For these scenarios, you can first issue a Pause request to a Controller host. After troubleshooting with the stream is done, you can issue another request to Controller to resume the consumption.
When a Pause request is issued, Controller instructs the realtime servers hosting your table to commit their consuming segments immediately. However, the commit process may take some time to complete. Please note that Pause and Resume requests are async. OK response means that instructions for pausing or resuming has been successfully sent to the realtime server. If you want to know if the consumptions actually stopped or resumed, you can issue a pause status request.
It's worth noting that consuming segments on realtime servers are stored in volatile memory, and their resources are allocated when the consuming segments are first created. These resources cannot be altered if consumption parameters are changed midway through consumption. It may therefore take hours before these changes take effect. Furthermore, if the parameters are changed in an incompatible way (for example, changing the underlying stream with a completely new set of offsets, or changing the stream endpoint from which to consume messages, etc.), it will result in the table getting into an error state.
Pause and resume feature comes to the rescue here. When a Pause request is issued by the operator, consuming segments are committed without starting new mutables ones. Instead, new mutable segments are started only when the Resume request is issued. This mechanism provides the operators as well as developers with more flexibility. It also enables Pinot to be more resilient to the operational and functional constraints imposed by underlying streams.
There is another feature called "Force Commit" which utilizes the primitives of pause and resume feature. When the operator issues a force commit request, the current mutable segments will be committed and new ones started right away. Operators can now use this feature for all compatible table config parameter changes to take effect immediately.
(v 0.12.0+) Once submitted, the forceCommit API returns a jobId that can be used to get the current progress of the forceCommit operation. A sample response and status API call:
For incompatible parameter changes, an option is added to the resume request to handle the case of a completely new set of offsets. Operators can now follow a three-step process: First, issue a Pause request. Second, change the consumption parameters. Finally, issue the Resume request with the appropriate option. These steps will preserve the old data and allow the new data to be consumed immediately. All through the operation, queries will continue to be served.
If a Pinot table is configured to consume using a (partition-based) stream type, then it is possible that the partitions of the table change over time. In Kafka, for example, the number of partitions may increase. In Kinesis, the number of partitions may increase or decrease -- some partitions could be merged to create a new one, or existing partitions split to create new ones.
Pinot runs a periodic task called RealtimeSegmentValidationManager that monitors such changes and starts consumption on new partitions (or stops consumptions from old ones) as necessary. Since this is a that is run on the controller, it may take some time for Pinot to recognize new partitions and start consuming from them. This may delay the data in new partitions appearing in the results that pinot returns.
If it is desired to recognize the new partitions sooner, then you can the periodic task so as to recognize such data immediately.
Often, it is important to understand the rate of ingestion of data into your realtime table. This is commonly done by looking at the consumption "lag" of the consumer. The lag itself can be observed in many dimensions. Pinot supports observing consumption lag along the offset dimension and time dimension, whenever applicable (as it depends on the specifics of the connector).
The ingestion status of a connector can be observed by querying either the /consumingSegmentsInfo API or the table's /debug API, as shown below:
A sample response from a Kafka based realtime table is shown below. The ingestion status is displayed for each of the CONSUMING segments in the table.
Term
Description
Realtime ingestion includes 3 stages of message processing: Decode, Transform and Index.
In each of these stages, a failure can happen which may or may not result in an ingestion failure. The following metrics are available to investigation ingestion issues:
Decode stage -> error here is recorded as INVALID_REALTIME_ROWS_DROPPED
Transform stage -> possible errors here are:
When a message gets dropped due to the transform, it is recorded as REALTIME_ROWS_FILTERED
There is yet another metric called ROWS_WITH_ERROR which is the sum of all error counts in the 3 stages above.
Furthermore, the metric REALTIME_CONSUMPTION_EXCEPTIONS gets incremented whenever there is a transient/permanent stream exception seen during consumption.
These metrics can be used to understand why ingestion failed for a particular table partition before diving into the server logs.
Text search support
This page talks about support for text search functionality in Pinot.
Pinot supports super-fast query processing through its indexes on non-BLOB like columns. Queries with exact match filters are run efficiently through a combination of dictionary encoding, inverted index, and sorted index.
It would be useful for a query like the following:
This query does exact matches on two columns of type STRING and INT respectively.
For arbitrary text data that falls into the BLOB/CLOB territory, we need more than exact matches. Users are interested in doing regex, phrase, fuzzy queries on BLOB like data. Before 0.3.0, one had to use to achieve this. However, this was scan based which was not performant and features like fuzzy search (edit distance search) were not possible.
In version 0.3.0, we added support for text indexes to efficiently do arbitrary search on STRING columns where each column value is a large BLOB of text. This can be achieved by using the new built-in function TEXT_MATCH.
tableIndexConfig - defines which column to use for indexing along with the type of index. For full configuration, see [Indexing Configs]. It has the following required fields -
loadMode - specifies how the segments should be loaded. Should beheap or mmap. Here's the difference between both the configs
mmap: Segments are loaded onto memory-mapped files. This is the default mode.
heap: Segments are loaded into direct memory. Note, 'heap' here is a legacy misnomer, and it does not imply JVM heap. This mode should only be used when we want faster performance than memory-mapped files, and are also sure that we will never run into OOM.
streamConfig - specifies the data source along with the necessary configs to start consuming the real-time data. The streamConfig can be thought of as the equivalent to the job spec for batch ingestion. The following options are supported:
lowLevel - Consume data from each partition with offset management
highLevel - Consume data without control over the partitions
stream.[streamType].topic.name
The datasource (e.g. topic, data stream) from which to consume the data
String
stream.[streamType].decoder.class.name
Name of the class to be used for parsing the data. The class should implement org.apache.pinot.spi.stream.StreamMessageDecoder interface
Determines the offset from which to start the ingestion
smallest
largest or
timestamp in milliseconds
topic.consumption.rate.limit
Determines the upper bound for consumption rate for the whole topic.
Having a consumption rate limiter is beneficial in case the stream message rate has a bursty pattern which leads to long GC pauses on the Pinot servers. The rate limiter can also be considered as a safeguard against excessive ingestion of realtime tables.
Double. The values should be greater than zero.
realtime.segment.flush.threshold.segment.size
The desired size of a completed realtime segment. This config is used only if realtime.segment.flush.threshold.rows is set to 0.
recordsAvailabilityLagMap
(Whenever applicable) Defines how soon after record ingestion was the record consumed by Pinot. This is calculated as the difference between the time the record was consumed and the time at which the record was ingested upstream.
When the transform pipeline sets the $INCOMPLETE_RECORD_KEY$ key in the message, it is recorded as INCOMPLETE_REALTIME_ROWS_CONSUMED , only when continueOnError configuration is enabled. If the continueOnError is not enabled, the ingestion fails.
Index stage -> When there is failure at this stage, the ingestion typically stops and marks the partition as ERROR.
The streaming platform from which to consume the data
kafka
stream.[streamType].consumer.type
realtime.segment.flush.threshold.time
Time threshold that will keep the realtime segment open for before we complete the segment. Noted that this time should be smaller than the Kafka retention period configured for the corresponding topic.
A consumption rate limiter is set up for topic <topic_name> in table <tableName> with rate limit: <rate_limit> (topic rate limit: <topic_rate_limit>, partition count: <partition_count>)
$ curl -X POST {controllerHost}/tables/{tableName}/forceCommit
$ curl -X POST {controllerHost}/tables/{tableName}/pauseConsumption
$ curl -X POST {controllerHost}/tables/{tableName}/resumeConsumption
$ curl -X POST {controllerHost}/tables/{tableName}/pauseStatus
$ curl -X POST {controllerHost}/tables/{tableName}/forceCommit
$ curl -X POST {controllerHost}/tables/{tableName}/resumeConsumption?resumeFrom=smallest
$ curl -X POST {controllerHost}/tables/{tableName}/resumeConsumption?resumeFrom=largest
# GET /tables/{tableName}/consumingSegmentsInfo
curl -X GET "http://<controller_url:controller_admin_port>/tables/meetupRsvp/consumingSegmentsInfo" -H "accept: application/json"
# GET /debug/tables/{tableName}
curl -X GET "http://localhost:9000/debug/tables/meetupRsvp?type=REALTIME&verbosity=1" -H "accept: application/json"
{
"_segmentToConsumingInfoMap": {
"meetupRsvp__0__0__20221019T0639Z": [
{
"serverName": "Server_192.168.0.103_7000",
"consumerState": "CONSUMING",
"lastConsumedTimestamp": 1666161593904,
"partitionToOffsetMap": { // <<-- Deprecated. See currentOffsetsMap for same info
"0": "6"
},
"partitionOffsetInfo": {
"currentOffsetsMap": {
"0": "6" // <-- Current consumer position
},
"latestUpstreamOffsetMap": {
"0": "6" // <-- Upstream latest position
},
"recordsLagMap": {
"0": "0" // <-- Lag, in terms of #records behind latest
},
"recordsAvailabilityLagMap": {
"0": "2" // <-- Lag, in terms of time
}
}
}
],
currentOffsetsMap
Current consuming offset position per partition
latestUpstreamOffsetMap
(Wherever applicable) Latest offset found in the upstream topic partition
Whether to use per partition low-level consumer or high-level stream consumer
Row count flush threshold for realtime segments. This behaves in a similar way for HLC and LLC. For HLC,
since there is only one consumer per server, this size is used as the size of the consumption buffer and determines after how many rows we flush to disk. For example, if this threshold is set to two million rows,
then a high level consumer would have a buffer size of two million.
If this value is set to 0, then the consumers adjust the number of rows consumed by a partition such that the size of the completed segment is the desired size (unless
threshold.time is reached first)
(Whenever applicable) Defines how far behind the current record's offset / pointer is from upstream latest record. This is calculated as the difference between the latestUpstreamOffset and currentOffset for the partition when the lag computation request is made.
where <column_name> is the column text index is created on and <search_expression> can be:
Text search should ideally be used on STRING columns where doing standard filter operations (EQUALITY, RANGE, BETWEEN) doesn't fit the bill because each column value is a reasonably large blob of text.
Consider the following snippet from Apache access log. Each line in the log consists of arbitrary data (IP addresses, URLs, timestamps, symbols etc) and represents a column value. Data like this is a good candidate for doing text search.
Let's say the following snippet of data is stored in ACCESS_LOG_COL column in Pinot table.
Few examples of search queries on this data:
Count the number of GET requests.
Count the number of POST requests that have administrator in the URL (administrator/index)
Count the number of POST requests that have a particular URL and handled by Firefox browser
Consider another example of simple resume text. Each line in the file represents skill-data from resumes of different candidates
Let's say the following snippet of data is stored in SKILLS_COL column in Pinot table. Each line in the input text represents a column value.
Few examples of search queries on this data:
Count the number of candidates that have "machine learning" and "gpu processing" - a phrase search (more on this further in the document) where we are looking for exact match of phrases "machine learning" and "gpu processing" not necessarily in the same order in original data.
Count the number of candidates that have "distributed systems" and either 'Java' or 'C++' - a combination of searching for exact phrase "distributed systems" along with other terms.
Consider a snippet from a log file containing SQL queries handled by a database. Each line (query) in the file represents a column value in QUERY_LOG_COL column in Pinot table.
Few examples of search queries on this data:
Count the number of queries that have GROUP BY
Count the number of queries that have the SELECT count... pattern
Count the number of queries that use BETWEEN filter on timestamp column along with GROUP BY
Further sections in the document cover several concrete examples on each kind of query and step-by-step guide on how to write text search queries in Pinot.
Currently we support text search in a restricted manner. More specifically, we have the following constraints:
The column type should be STRING.
The column should be single-valued.
Co-existence of text index with other Pinot indexes is currently not supported.
The last two restrictions are going to be relaxed very soon in the upcoming releases.
Currently, a column in Pinot can be dictionary encoded or stored RAW. Furthermore, we can create inverted index on the dictionary encoded column. We can also create a sorted index on the dictionary encoded column.
Text index is an addition to the type of per-column indexes users can create in Pinot. However, the current implementation supports text index on RAW column. In other words, the column should not be dictionary encoded. As we relax this constraint in upcoming releases, text index can be created on a dictionary encoded column that also has other indexes (inverted, sorted etc).
Similar to other indexes, users can enable text index on a column through table config. As part of text-search feature, we have also introduced a new generic way of specifying the per-column encoding and index information. In the table config, there will be a new section with the name "fieldConfigList".
"fieldConfigList" will be a new section in table config. It is essentially a list of per-column encoding and index information. In the above example, the list contains text index information for two columns text_col_1 and text_col_2. Each object in fieldConfigList contains the following information
name - Name of the column text index is enabled on
encodingType - As mentioned earlier, we can store a column either as RAW or dictionary encoded. Since for now we have a restriction on the text index, this should always be RAW.
indexType - This should be TEXT.
Since we haven't yet removed the old way of specifying the index info, each column that has a text index should also be specified as noDictionaryColumns in tableIndexConfig:
The above mechanism can be used to configure text indexes in the following scenarios:
Adding a new table with text index enabled on one or more columns.
Adding a new column with text index enabled to an existing table.
Enabling text index on an existing column.
Once the text index is enabled on one or more columns through table config, our segment generation code will pick up the config and automatically create text index (per column). This is exactly how other indexes in Pinot are created.
Text index is supported for both offline and real-time segments.
The original text document (a value in the column with text index enabled) is parsed, tokenized and individual "indexable" terms are extracted. These terms are inserted into the index.
Pinot's text index is built on top of Lucene. Lucene's standard english text tokenizer generally works well for most classes of text. We might want to build custom text parser and tokenizer to suit particular user requirements. Accordingly, we can make this configurable for the user to specify on per column text index basis.
There is a default set of "stop words" built in Pinot's text index. This is a set of high frequency words in English that are excluded for search efficiency and index size, including:
Any occurrence of these words in will be ignored by the tokenizer during index creation and search.
In some cases, users might want to customize the set. A good example would be when IT (Information Technology) appears in the text that collides with "it", or some context-specific words that are not informative in the search. To do this, one can config the words in fieldConfig to include/exclude from the default stop words:
The words should be comma separated and in lowercase. Duplicated words in both list will end up get excluded.
A new built-in function TEXT_MATCH has been introduced for using text search in SQL/PQL.
TEXT_MATCH(text_column_name, search_expression)
text_column_name - name of the column to do text search on.
search_expression - search query
We can use TEXT_MATCH function as part of our queries in the WHERE clause. Examples:
We can also use the TEXT_MATCH filter clause with other filter operators. For example:
Combining multiple TEXT_MATCH filter clauses
TEXT_MATCH can be used in WHERE clause of all kinds of queries supported by Pinot
Selection query which projects one or more columns
User can also include the text column name in select list
Aggregation query
Aggregation GROUP BY query
The search expression (second argument to TEXT_MATCH function) is the query string that Pinot will use to perform text search on the column's text index. _**_Following expression types are supported
This query is used to do exact match of a given phrase. Exact match implies that terms in the user-specified phrase should appear in the exact same order in the original text document. Note that document is referred to as the column value.
Let's take the example of resume text data containing 14 documents to walk through queries. The data is stored in column named SKILLS_COL and we have created a text index on this column.
Example 1 - Search in SKILL_COL column to look for documents where each matching document MUST contain phrase "distributed systems" as is
The search expression is '\"Distributed systems\"'
The search expression is always specified within single quotes '<your expression>'
Since we are doing a phrase search, the phrase should be specified within double quotes inside the single quotes and the double quotes should be escaped
'\"<your phrase>\"'
The above query will match the following documents:
But it won't match the following document:
This is because the phrase query looks for the phrase occurring in the original document "as is". The terms as specified by the user in phrase should be in the exact same order in the original document for the document to be considered as a match.
NOTE: Matching is always done in a case-insensitive manner.
Example 2 - Search in SKILL_COL column to look for documents where each matching document MUST contain phrase "query processing" as is
The above query will match the following documents:
Term queries are used to search for individual terms
Example 3 - Search in SKILL_COL column to look for documents where each matching document MUST contain the term 'java'
As mentioned earlier, the search expression is always within single quotes. However, since this is a term query, we don't have to use double quotes within single quotes.
Boolean operators AND, OR are supported and we can use them to build a composite query. Boolean operators can be used to combine phrase and term queries in any arbitrary manner
Example 4 - Search in SKILL_COL column to look for documents where each matching document MUST contain phrases "distributed systems" and "tensor flow". This combines two phrases using AND boolean operator
The above query will match the following documents:
Example 5 - Search in SKILL_COL column to look for documents where each document MUST contain phrase "machine learning" and term 'gpu' and term 'python'. This combines a phrase and two terms using boolean operator
The above query will match the following documents:
When using Boolean operators to combine term(s) and phrase(s) or both, please note that:
The matching document can contain the terms and phrases in any order.
The matching document may not have the terms adjacent to each other (if this is needed, please use appropriate phrase query for the concerned terms).
Use of OR operator is implicit. In other words, if phrase(s) and term(s) are not combined using AND operator in the search expression, OR operator is used by default:
Example 6 - Search in SKILL_COL column to look for documents where each document MUST contain ANY one of:
phrase "distributed systems" OR
term 'java' OR
term 'C++'.
We can also do grouping using parentheses:
Example 7 - Search in SKILL_COL column to look for documents where each document MUST contain
phrase "distributed systems" AND
at least one of the terms Java or C++
In the below query, we group terms Java and C++ without any operator which implies the use of OR. The root operator AND is used to combine this with phrase "distributed systems"
Prefix searches can also be done in the context of a single term. We can't use prefix matches for phrases.
Example 8 - Search in SKILL_COL column to look for documents where each document MUST contain text like stream, streaming, streams etc
The above query will match the following documents:
Phrase and term queries work on the fundamental logic of looking up the terms (aka tokens) in the text index. The original text document (a value in the column with text index enabled) is parsed, tokenized and individual "indexable" terms are extracted. These terms are inserted into the index.
Based on the nature of original text and how the text is segmented into tokens, it is possible that some terms don't get indexed individually. In such cases, it is better to use regular expression queries on the text index.
Consider server log as an example and we want to look for exceptions. A regex query is suitable for this scenario as it is unlikely that 'exception' is present as an individual indexed token.
Syntax of a regex query is slightly different from queries mentioned earlier. The regular expression is written between a pair of forward slashes (/).
The above query will match any text document containing exception.
Generally, a combination of phrase and term queries using boolean operators and grouping should allow us to build a complex text search query expression.
The key thing to remember is that phrases should be used when the order of terms in the document is important and if separating the phrase into individual terms doesn't make sense from end user's perspective.
An example would be phrase "machine learning".
However, if we are searching for documents matching Java and C++ terms, using phrase query "Java C++" will actually result in in partial results (could be empty too) since now we are relying the on the user specifying these skills in the exact same order (adjacent to each other) in the resume text.
Term query using boolean AND operator is more appropriate for such cases
SELECT COUNT(*)
FROM Foo
WHERE STRING_COL = 'ABCDCD'
AND INT_COL > 2000
SELECT COUNT(*)
FROM Foo
WHERE TEXT_MATCH (<column_name>, '<search_expression>')
SELECT COUNT(*)
FROM MyTable
WHERE TEXT_MATCH(ACCESS_LOG_COL, 'GET')
SELECT COUNT(*)
FROM MyTable
WHERE TEXT_MATCH(ACCESS_LOG_COL, 'post AND administrator AND index')
SELECT COUNT(*)
FROM MyTable
WHERE TEXT_MATCH(ACCESS_LOG_COL, 'post AND administrator AND index AND firefox')
Distributed systems, Java, C++, Go, distributed query engines for analytics and data warehouses, Machine learning, spark, Kubernetes, transaction processing
Java, Python, C++, Machine learning, building and deploying large scale production systems, concurrency, multi-threading, CPU processing
C++, Python, Tensor flow, database kernel, storage, indexing and transaction processing, building large scale systems, Machine learning
Amazon EC2, AWS, hadoop, big data, spark, building high performance scalable systems, building and deploying large scale production systems, concurrency, multi-threading, Java, C++, CPU processing
Distributed systems, database development, columnar query engine, database kernel, storage, indexing and transaction processing, building large scale systems
Distributed systems, Java, realtime streaming systems, Machine learning, spark, Kubernetes, distributed storage, concurrency, multi-threading
CUDA, GPU, Python, Machine learning, database kernel, storage, indexing and transaction processing, building large scale systems
Distributed systems, Java, database engine, cluster management, docker image building and distribution
Kubernetes, cluster management, operating systems, concurrency, multi-threading, apache airflow, Apache Spark,
Apache spark, Java, C++, query processing, transaction processing, distributed storage, concurrency, multi-threading, apache airflow
Big data stream processing, Apache Flink, Apache Beam, database kernel, distributed query engines for analytics and data warehouses
CUDA, GPU processing, Tensor flow, Pandas, Python, Jupyter notebook, spark, Machine learning, building high performance scalable systems
Distributed systems, Apache Kafka, publish-subscribe, building and deploying large scale production systems, concurrency, multi-threading, C++, CPU processing, Java
Realtime stream processing, publish subscribe, columnar processing for data warehouses, concurrency, Java, multi-threading, C++,
SELECT SKILLS_COL
FROM MyTable
WHERE TEXT_MATCH(SKILLS_COL, '"Machine learning" AND "gpu processing"')
SELECT SKILLS_COL
FROM MyTable
WHERE TEXT_MATCH(SKILLS_COL, '"distributed systems" AND (Java C++)')
SELECT count(dimensionCol2) FROM FOO WHERE dimensionCol1 = 18616904 AND timestamp BETWEEN 1560988800000 AND 1568764800000 GROUP BY dimensionCol3 TOP 2500
SELECT count(dimensionCol2) FROM FOO WHERE dimensionCol1 = 18616904 AND timestamp BETWEEN 1560988800000 AND 1568764800000 GROUP BY dimensionCol3 TOP 2500
SELECT count(dimensionCol2) FROM FOO WHERE dimensionCol1 = 18616904 AND timestamp BETWEEN 1545436800000 AND 1553212800000 GROUP BY dimensionCol3 TOP 2500
SELECT count(dimensionCol2) FROM FOO WHERE dimensionCol1 = 18616904 AND timestamp BETWEEN 1537228800000 AND 1537660800000 GROUP BY dimensionCol3 TOP 2500
SELECT dimensionCol2, dimensionCol4, timestamp, dimensionCol5, dimensionCol6 FROM FOO WHERE dimensionCol1 = 18616904 AND timestamp BETWEEN 1561366800000 AND 1561370399999 AND dimensionCol3 = 2019062409 LIMIT 10000
SELECT dimensionCol2, dimensionCol4, timestamp, dimensionCol5, dimensionCol6 FROM FOO WHERE dimensionCol1 = 18616904 AND timestamp BETWEEN 1563807600000 AND 1563811199999 AND dimensionCol3 = 2019072215 LIMIT 10000
SELECT dimensionCol2, dimensionCol4, timestamp, dimensionCol5, dimensionCol6 FROM FOO WHERE dimensionCol1 = 18616904 AND timestamp BETWEEN 1563811200000 AND 1563814799999 AND dimensionCol3 = 2019072216 LIMIT 10000
SELECT dimensionCol2, dimensionCol4, timestamp, dimensionCol5, dimensionCol6 FROM FOO WHERE dimensionCol1 = 18616904 AND timestamp BETWEEN 1566327600000 AND 1566329400000 AND dimensionCol3 = 2019082019 LIMIT 10000
SELECT count(dimensionCol2) FROM FOO WHERE dimensionCol1 = 18616904 AND timestamp BETWEEN 1560834000000 AND 1560837599999 AND dimensionCol3 = 2019061805 LIMIT 0
SELECT count(dimensionCol2) FROM FOO WHERE dimensionCol1 = 18616904 AND timestamp BETWEEN 1560870000000 AND 1560871800000 AND dimensionCol3 = 2019061815 LIMIT 0
SELECT count(dimensionCol2) FROM FOO WHERE dimensionCol1 = 18616904 AND timestamp BETWEEN 1560871800001 AND 1560873599999 AND dimensionCol3 = 2019061815 LIMIT 0
SELECT count(dimensionCol2) FROM FOO WHERE dimensionCol1 = 18616904 AND timestamp BETWEEN 1560873600000 AND 1560877199999 AND dimensionCol3 = 2019061816 LIMIT 0
SELECT COUNT(*)
FROM MyTable
WHERE TEXT_MATCH(QUERY_LOG_COL, '"group by"')
SELECT COUNT(*)
FROM MyTable
WHERE TEXT_MATCH(QUERY_LOG_COL, '"select count"')
SELECT COUNT(*)
FROM MyTable
WHERE TEXT_MATCH(QUERY_LOG_COL, '"timestamp between" AND "group by"')
SELECT COUNT(*) FROM Foo WHERE TEXT_MATCH(...)
SELECT * FROM Foo WHERE TEXT_MATCH(...)
SELECT COUNT(*) FROM Foo WHERE TEXT_MATCH(...) AND some_other_column_1 > 20000
SELECT COUNT(*) FROM Foo WHERE TEXT_MATCH(...) AND some_other_column_1 > 20000 AND some_other_column_2 < 100000
SELECT COUNT(*) FROM Foo WHERE TEXT_MATCH(text_col_1, ....) AND TEXT_MATCH(text_col_2, ...)
Java, C++, worked on open source projects, coursera machine learning
Machine learning, Tensor flow, Java, Stanford university,
Distributed systems, Java, C++, Go, distributed query engines for analytics and data warehouses, Machine learning, spark, Kubernetes, transaction processing
Java, Python, C++, Machine learning, building and deploying large scale production systems, concurrency, multi-threading, CPU processing
C++, Python, Tensor flow, database kernel, storage, indexing and transaction processing, building large scale systems, Machine learning
Amazon EC2, AWS, hadoop, big data, spark, building high performance scalable systems, building and deploying large scale production systems, concurrency, multi-threading, Java, C++, CPU processing
Distributed systems, database development, columnar query engine, database kernel, storage, indexing and transaction processing, building large scale systems
Distributed systems, Java, realtime streaming systems, Machine learning, spark, Kubernetes, distributed storage, concurrency, multi-threading
CUDA, GPU, Python, Machine learning, database kernel, storage, indexing and transaction processing, building large scale systems
Distributed systems, Java, database engine, cluster management, docker image building and distribution
Kubernetes, cluster management, operating systems, concurrency, multi-threading, apache airflow, Apache Spark,
Apache spark, Java, C++, query processing, transaction processing, distributed storage, concurrency, multi-threading, apache airflow
Big data stream processing, Apache Flink, Apache Beam, database kernel, distributed query engines for analytics and data warehouses
CUDA, GPU processing, Tensor flow, Pandas, Python, Jupyter notebook, spark, Machine learning, building high performance scalable systems
Distributed systems, Apache Kafka, publish-subscribe, building and deploying large scale production systems, concurrency, multi-threading, C++, CPU processing, Java
Realtime stream processing, publish subscribe, columnar processing for data warehouses, concurrency, Java, multi-threading, C++,
C++, Java, Python, realtime streaming systems, Machine learning, spark, Kubernetes, transaction processing, distributed storage, concurrency, multi-threading, apache airflow
Databases, columnar query processing, Apache Arrow, distributed systems, Machine learning, cluster management, docker image building and distribution
Database engine, OLAP systems, OLTP transaction processing at large scale, concurrency, multi-threading, GO, building large scale systems
SELECT SKILLS_COL
FROM MyTable
WHERE TEXT_MATCH(SKILLS_COL, '"Distributed systems"')
Distributed systems, Java, C++, Go, distributed query engines for analytics and data warehouses, Machine learning, spark, Kubernetes, transaction processing
Distributed systems, database development, columnar query engine, database kernel, storage, indexing and transaction processing, building large scale systems
Distributed systems, Java, realtime streaming systems, Machine learning, spark, Kubernetes, distributed storage, concurrency, multi-threading
Distributed systems, Java, database engine, cluster management, docker image building and distribution
Distributed systems, Apache Kafka, publish-subscribe, building and deploying large scale production systems, concurrency, multi-threading, C++, CPU processing, Java
Databases, columnar query processing, Apache Arrow, distributed systems, Machine learning, cluster management, docker image building and distribution
Distributed data processing, systems design experience
SELECT SKILLS_COL
FROM MyTable
WHERE TEXT_MATCH(SKILLS_COL, '"query processing"')
SELECT SKILLS_COL
FROM MyTable
WHERE TEXT_MATCH(SKILLS_COL, 'Java')
SELECT SKILLS_COL
FROM MyTable
WHERE TEXT_MATCH(SKILLS_COL, '"Machine learning" AND "Tensor Flow"')
Machine learning, Tensor flow, Java, Stanford university,
C++, Python, Tensor flow, database kernel, storage, indexing and transaction processing, building large scale systems, Machine learning
CUDA, GPU processing, Tensor flow, Pandas, Python, Jupyter notebook, spark, Machine learning, building high performance scalable systems
SELECT SKILLS_COL
FROM MyTable
WHERE TEXT_MATCH(SKILLS_COL, '"Machine learning" AND gpu AND python')
CUDA, GPU, Python, Machine learning, database kernel, storage, indexing and transaction processing, building large scale systems
CUDA, GPU processing, Tensor flow, Pandas, Python, Jupyter notebook, spark, Machine learning, building high performance scalable systems
SELECT SKILLS_COL
FROM MyTable
WHERE TEXT_MATCH(SKILLS_COL, '"distributed systems" Java C++')
SELECT SKILLS_COL
FROM MyTable
WHERE TEXT_MATCH(SKILLS_COL, '"distributed systems" AND (Java C++)')
SELECT SKILLS_COL
FROM MyTable
WHERE TEXT_MATCH(SKILLS_COL, 'stream*')
Distributed systems, Java, realtime streaming systems, Machine learning, spark, Kubernetes, distributed storage, concurrency, multi-threading
Big data stream processing, Apache Flink, Apache Beam, database kernel, distributed query engines for analytics and data warehouses
Realtime stream processing, publish subscribe, columnar processing for data warehouses, concurrency, Java, multi-threading, C++,
C++, Java, Python, realtime streaming systems, Machine learning, spark, Kubernetes, transaction processing, distributed storage, concurrency, multi-threading, apache airflow
SELECT SKILLS_COL
FROM MyTable
WHERE text_match(SKILLS_COL, '/.*Exception/')
TEXT_MATCH(column, '"machine learning"')
TEXT_MATCH(column, '"Java C++"')
TEXT_MATCH(column, 'Java AND C++')
Sample Datasets
Apache Access Log
Resume text
Query Log
Current restrictions
Co-existence with other indexes
How to enable text index?
fieldConfigListis currently ONLY used for text indexes. Our plan is to migrate all other indexes to this model. We are going to do that in upcoming releases and accordingly modify user documentation. So please continue to specify other index info in table config as you have done till now and use the fieldConfigListonly for text indexes.
When you're using a Text index, we would recommend that you add the indexed column to the noDictionaryColumns columns list to reduce unnecessary storage overhead.
For instructions on that config property, see the documentation.
Text Index Creation
Text parsing and tokenization
Writing Text Search Queries
Phrase Query
Term Query
Composite Query using Boolean Operators
Prefix Query
Regular Expression Query
Deciding Query Types
Star-Tree Index
Unlike other index techniques which work on single column, the Star-Tree index is built on multiple columns, and utilizes pre-aggregated results to significantly reduce the number of values to be processed, thus improving query performance.
One of the biggest challenges in realtime OLAP systems is achieving and maintaining tight SLAs on latency and throughput on large data sets. Existing techniques such as or help improve query latencies, but speed-ups are still limited by the number of documents that need to be processed to compute results. On the other hand, pre-aggregating the results ensures a constant upper bound on query latencies, but can lead to storage space explosion.
Here we introduce star-tree index to utilize the pre-aggregated documents in a smart way to achieve low query latencies but also use the storage space efficiently for aggregation/group-by queries.
Consider the following data set as an example to discuss the existing approaches:
GitHub Events Stream
Steps for setting up a Pinot cluster and a realtime table which consumes from the GitHub events stream.
In this approach, data is sorted on a primary key, which is likely to appear as filter in most queries in the query set.
This reduces the time to search the documents for a given primary key value from linear scan O(n) to binary search O(logn), and also keeps good locality for the documents selected.
While this is a good improvement over linear scan, there are still a few issues with this approach:
While sorting on one column does not require additional space, sorting on additional columns would require additional storage space to re-index the records for the various sort orders.
While search time is reduced from O(n) to O(logn), overall latency is still a function of total number of documents need to be processed to answer a query.
In this approach, for each value of a given column, we maintain a list of document id’s where this value appears.
Below are the inverted indexes for columns ‘Browser’ and ‘Locale’ for our example data set:
Browser
Doc Id
Firefox
1,5,6
Chrome
0,4
Safari
Locale
Doc Id
en
0,3,4,6
es
2,5
fr
For example, if we want to get all the documents where ‘Browser’ is ‘Firefox’, we can look up the inverted index for ‘Browser’ and identify that it appears in documents [1, 5, 6].
Using an inverted index, we can reduce the search time to constant time O(1). The query latency, however, is still a function of the selectivity of the query, i.e. it increases with the number of documents that need to be processed to answer the query.
In this technique, we pre-compute the answer for a given query set upfront.
In the example below, we have pre-aggregated the total impressions for each country:
Country
Impressions
CA
600
MX
400
USA
With this approach, answering queries about total impressions for a country is a value lookup, because we have eliminated the need to process a large number of documents. However, to be able to answer queries that have multiple predicates means we would need to pre-aggregate for various combinations of different dimensions, which leads to an exponential explosion in storage space.
On one end of the spectrum we have indexing techniques that improve search times with a limited increase in space, but do not guarantee a hard upper bound on query latencies. On the other end of the spectrum we have pre-aggregation techniques that offer hard upper bound on query latencies, but suffer from exponential explosion of storage space
Space-Time Trade Off Between Different Techniques
The Star-Tree data structure offers a configurable trade-off between space and time and lets us achieve hard upper bound for query latencies for a given use case. In the following sections we will define the Star-Tree data structure, and explains how Pinot uses it to achieve low latencies with high throughput.
Tree structure
Star-tree is a tree data structure that consists of the following properties:
Star-tree Structure
Root Node (Orange): Single root node, from which the rest of the tree can be traversed.
Leaf Node (Blue): A leaf node can containing at most T records, where T is configurable.
Non-leaf Node (Green): Nodes with more than T records are further split into children nodes.
Star-Node (Yellow): Non-leaf nodes can also have a special child node called the Star-Node. This node contains the pre-aggregated records after removing the dimension on which the data was split for this level.
Dimensions Split Order ([D1, D2]): Nodes at a given level in the tree are split into children nodes on all values of a particular dimension. The dimensions split order is an ordered list of dimensions that is used to determine the dimension to split on for a given level in the tree.
Node properties
The properties stored in each node are as follows:
Dimension: The dimension that the node is split on
Start/End Document Id: The range of documents this node points to
Aggregated Document Id: One single document that is the aggregation result of all documents pointed by this node
Star-tree index is generated in the following steps:
The data is first projected as per the dimensionsSplitOrder. Only the dimensions from the split order are reserved, others are dropped. For each unique combination of reserved dimensions, metrics are aggregated per configuration. The aggregated documents are written to a file and served as the initial Star-Tree documents (separate from the original documents).
Sort the Star-Tree documents based on the dimensionsSplitOrder. It is primary-sorted on the first dimension in this list, and then secondary sorted on the rest of the dimensions based on their order in the list. Each node in the tree points to a range in the sorted documents.
The tree structure can be created recursively (starting at root node) as follows:
If a node has more than T records, it is split into multiple children nodes, one for each value of the dimension in the split order corresponding to current level in the tree.
A Star-Node can be created (per configuration) for the current node, by dropping the dimension being split on, and aggregating the metrics for rows containing dimensions with identical values. These aggregated documents are appended to the end of the Star-Tree documents.
If there is only one value for the current dimension, Star-Node won’t be created because the documents under the Star-Node are identical to the single node.
The above step is repeated recursively until there are no more nodes to split.
Multiple Star-Trees can be generated based on different configurations (dimensionsSplitOrder, aggregations, T)
Aggregation is configured as a pair of aggregation functions and the column to apply the aggregation.
All types of aggregation function that have a bounded-sized intermediate result are supported.
Supported functions
COUNT
MIN
MAX
SUM
AVG
MIN_MAX_RANGE
DISTINCT_COUNT_HLL
PERCENTILE_EST
PERCENTILE_TDIGEST
DISTINCT_COUNT_BITMAP
NOTE: The intermediate result RoaringBitmap is not bounded-sized, use carefully on high cardinality columns)
Unsupported functions
DISTINCT_COUNT
Intermediate result Set is unbounded
SEGMENT_PARTITIONED_DISTINCT_COUNT:
Intermediate result Set is unbounded
PERCENTILE
Intermediate result List is unbounded
Functions to be supported
DISTINCT_COUNT_THETA_SKETCH
ST_UNION
Multiple index generation configurations can be provided to generate multiple star-trees. Each configuration should contain the following properties:
dimensionsSplitOrder: An ordered list of dimension names can be specified to configure the split order. Only the dimensions in this list are reserved in the aggregated documents. The nodes will be split based on the order of this list. For example, split at level i is performed on the values of dimension at index i in the list.
The star-tree dimension does not have to be a dimension column in the table, it can also be time column, date-time column, or metric column if necessary.
The star-tree dimension column should be dictionary encoded in order to generate the star-tree index.
All columns in the filter and group-by clause of a query should be included in this list in order to use the star-tree index.
skipStarNodeCreationForDimensions (Optional, default empty): A list of dimension names for which to not create the Star-Node.
functionColumnPairs: A list of aggregation function and column pairs (split by double underscore “__”). E.g. SUM__Impressions (SUM of column Impressions) or COUNT__*.
The column within the function-column pair can be either dictionary encoded or raw.
All aggregations of a query should be included in this list in order to use the star-tree index.
maxLeafRecords (Optional, default 10000): The threshold T to determine whether to further split each node.
A default star-tree index can be added to a segment by using the boolean config enableDefaultStarTree under the tableIndexConfig.
A default star-tree will have the following configuration:
All dictionary-encoded single-value dimensions with cardinality smaller or equal to a threshold (10000) will be included in the dimensionsSplitOrder, sorted by their cardinality in descending order.
All dictionary-encoded Time/DateTime columns will be appended to the _dimensionsSplitOrder _following the dimensions, sorted by their cardinality in descending order. Here we assume that time columns will be included in most queries as the range filter column and/or the group by column, so for better performance, we always include them as the last elements in the dimensionsSplitOrder.
Include COUNT(*) and SUM for all numeric metrics in the functionColumnPairs.
Use default maxLeafRecords (10000).
For our example data set, in order to solve the following query efficiently:
We may config the star-tree index as follows:
The star-tree and documents should be something like below:
The values in the parentheses are the aggregated sum of Impressions for all the documents under the node.
Star-tree documents
Country
Browser
Locale
SUM__Impressions
CA
Chrome
en
400
For query execution, the idea is to first check metadata to determine whether the query can be solved with the Star-Tree documents, then traverse the Star-Tree to identify documents that satisfy all the predicates. After applying any remaining predicates that were missed while traversing the Star-Tree to the identified documents, apply aggregation/group-by on the qualified documents.
The algorithm to traverse the tree can be described as follows:
Start from root node.
For each level, what child node(s) to select depends on whether there are any predicates/group-by on the split dimension for the level in the query.
If there is no predicate or group-by on the split dimension, select the Star-Node if exists, or all child nodes to traverse further.
If there are predicate(s) on the split dimension, select the child node(s) that satisfy the predicate(s).
If there is no predicate, but there is a group-by on the split dimension, select all child nodes except Star-Node.
Recursively repeat the previous step until all leaf nodes are reached, or all predicates are satisfied.
Collect all the documents pointed by the selected nodes.
If all predicates and group-by's are satisfied, pick the single aggregated document from each selected node.
Otherwise, collect all the documents in the document range from each selected node.note
There is a known bug in Star-Tree which can mistakenly apply Star-Tree index to queries with OR operator on top of nested AND or NOT operator in the filter that cannot be solved with Star-Tree, and cause wrong results. E.g. SELECT COUNT(*) FROM myTable WHERE (A = 1 AND B = 2) OR A = 2. This bug affects release 0.9.0, 0.9.1, 0.9.2, 0.9.3, 0.10.0.
d. Start server
Set up a Kafka cluster
Create a Kafka topic - pullRequestMergedEvents
Create a realtime table - pullRequestMergedEvents and a schema
Start a task which reads from GitHub events API and publishes events about merged pull requests to the topic.
Follow the instructions in Advanced Pinot Setup to setup the Pinot cluster with the components:
Zookeeper
Controller
Broker
Server
Kafka
Create a Kafka topic called pullRequestMergedEvents for the demo.
The schema is present at examples/stream/githubEvents/pullRequestMergedEvents_schema.json and is also pasted below
The table config is present at examples/stream/githubEvents/docker/pullRequestMergedEvents_realtime_table_config.json and is also pasted below.
Add the table and schema using the following command
Start streaming GitHub events into the Kafka topic
For a single command to setup all the above steps, use the following command. Make sure to stop any previous running Pinot services.
Follow instructions in to get the latest Pinot code
Follow the instructions in to setup the Pinot cluster with the components:
Zookeeper
Controller
If you already have a Kubernetes cluster with Pinot and Kafka (see Running Pinot in Kubernetes), first create the topic and then setup the table and streaming using
Head over to the Query Console to checkout the data!
You can use SuperSet to visualize this data. Some of the interesting insights we captures were
Repositories by number of commits in the Apache organization
$ cd kubernetes/helm
$ kubectl apply -f pinot-github-realtime-events.yml
Steps
Using Docker images or Launcher Scripts
Kubernetes cluster
Query
Visualizing on SuperSet
Most Active organizations during the lockdown
0.9.0
Summary
This release introduces a new features: Segment Merge and Rollup to simplify users day to day operational work. A new metrics plugin is added to support dropwizard. As usual, new functionalities and many UI/ Performance improvements.
The release was cut from the following commit: 13c9ee9 and the following cherry-picks: 668b5e0, ee887b9
Support Segment Merge and Roll-up
LinkedIn operates a large multi-tenant cluster that serves a business metrics dashboard, and noticed that their tables consisted of millions of small segments. This was leading to slow operations in Helix/Zookeeper, long running queries due to having too many tasks to process, as well as using more space because of a lack of compression.
To solve this problem they added the Segment Merge task, which compresses segments based on timestamps and rolls up/aggregates older data. The task can be run on a schedule or triggered manually via the Pinot REST API.
At the moment this feature is only available for offline tables, but will be added for real-time tables in a future release.
Major Changes:
Integrate enhanced SegmentProcessorFramework into MergeRollupTaskExecutor ()
Merge/Rollup task scheduler for offline tables. ()
Fix MergeRollupTask uploading segments not updating their metadata ()
This release also sees improvements to Pinot’s query console UI.
Cmd+Enter shortcut to run query in query console ()
Showing tooltip in SQL Editor ()
Make the SQL Editor box expandable ()
There have also been improvements and additions to Pinot’s SQL implementation.
IN ()
LASTWITHTIME ()
ID_SET on MV columns ()
LIKE()
REGEXP_EXTRACT()
FILTER()
Infer data type for Literal ()
Support logical identifier in predicate ()
Support JSON queries with top-level array path expression. ()
This release contains many performance improvement, you may sense it for you day to day queries. Thanks to all the great contributions listed below:
Reduce the disk usage for segment conversion task ()
Simplify association between Java Class and PinotDataType for faster mapping ()
Avoid creating stateless ParseContextImpl once per jsonpath evaluation, avoid varargs allocation ()
Human Readable Controller Configs ()
Add the support of geoToH3 function ()
Add Apache Pulsar as Pinot Plugin () ()
Fix null pointer exception for non-existed metric columns in schema for JDBC driver ()
Fix the config key for TASK_MANAGER_FREQUENCY_PERIOD ()
Note
If you're setting this up on a pre-configured cluster, set the properties stream.kafka.zk.broker.url and stream.kafka.broker.list correctly, depending on the configuration of your Kafka cluster.
If you're setting this up on a pre-configured cluster, set the properties stream.kafka.zk.broker.url and stream.kafka.broker.list correctly, depending on the configuration of your Kafka cluster.
Apache Pinot 0.11.0 has introduced many new features to extend the query abilities, e.g. the Multi-Stage query engine enables Pinot to do distributed joins, more sql syntax(DML support), query functions and indexes(Text index, Timestamp index) supported for new use cases. And as always, more integrations with other systems(E.g. Spark3, Flink).
Note: there is a major upgrade for Apache Helix to 1.0.4, so please make sure you upgrade the system in the order of:
The new multi-stage query engine (a.k.a V2 query engine) is designed to support more complex SQL semantics such as JOIN, OVER window, MATCH_RECOGNIZE and eventually, make Pinot support closer to full ANSI SQL semantics.
More to read: https://docs.pinot.apache.org/developers/advanced/v2-multi-stage-query-engine
Pause Stream Consumption on Apache Pinot
Pinot operators can pause realtime consumption of events while queries are being executed, and then resume consumption when ready to do so again.
The gapfilling functions allow users to interpolate data and perform powerful aggregations and data processing over time series data.
More to read:
Long waiting feature for segment generation on Spark 3.x.
Similar to the Spark Pinot connector, this allows Flink users to dump data from the Flink application to Pinot.
This feature allows better fine-grained control on pinot queries.
This allows users to have better query performance on the timestamp column for lower granularity. See:
Wanna search text in realtime? The new text indexing engine in Pinot supports the following capabilities:
New operator: LIKE
New operator: CONTAINS
Native text index, built from the ground up, focusing on Pinot’s time series use cases and utilizing existing Pinot indices and structures(inverted index, bitmap storage).
Real Time Text Index
Read more:
Now you can use INSERT INTO [database.]table FROM FILE dataDirURI OPTION ( k=v ) [, OPTION (k=v)]* to load data into Pinot from a file using Minion. See:
This feature supports enabling deduplication for realtime tables, via a top-level table config. At a high level, primaryKey (as defined in the table schema) hashes are stored into in-memory data structures, and each incoming row is validated against it. Duplicate rows are dropped.
The expectation while using this feature is for the stream to be partitioned by the primary key, strictReplicaGroup routing to be enabled, and the configured stream consumer type to be low level. These requirements are therefore mandated via table config API's input validations.
Add support for functions arrayConcatLong, arrayConcatFloat, arrayConcatDouble ()
Add support for regexpReplace scalar function ()
Add support for Base64 Encode/Decode Scalar Functions ()
add query cancel APIs on controller backed by those on brokers ()
Add an option to search input files recursively in ingestion job. The default is set to true to be backward compatible. ()
Adding endpoint to download local log files for each component ()
Pinot has resolved all the high-level vulnerabilities issues:
Add a new workflow to check vulnerabilities using trivy ()
Disable Groovy function by default ()
Upgrade netty due to security vulnerability ()
Nested arrays and map not handled correctly for complex types ()
Fix empty data block not returning schema ()
Allow mvn build with development webpack; fix instances default value ()
Optimize like to regexp conversion to do not include unnecessary ^._ and ._$ ()
Support DISTINCT on multiple MV columns ()
Support DISTINCT on single MV column ()
Add histogram aggregation function ()
Optimize dateTimeConvert scalar function to only parse the format once ()
Support conjugates for scalar functions, add more scalar functions ()
add FIRSTWITHTIME aggregate function support ()
Add PercentileSmartTDigestAggregationFunction ()
Simplify the parameters for DistinctCountSmartHLLAggregationFunction ()
add scalar function for cast so it can be calculated at compile time ()
Scalable Gapfill Implementation for Avg/Count/Sum ()
Add commonly used math, string and date scalar functions in Pinot ()
Datetime transform functions ()
Scalar function for url encoding and decoding ()
Add support for IS NULL and NOT IS NULL in transform functions ()
Support st_contains using H3 index ()
Add metrics to track controller segment download and upload requests in progress ()
add a freshness based consumption status checker ()
Force commit consuming segments ()
Adding kafka offset support for period and timestamp ()
Make upsert metadata manager pluggable ()
Adding logger utils and allow change logger level at runtime ()
Proper null handling in equality, inequality and membership operators for all SV column data types ()
support to show running queries and cancel query by id ()
Enhance upsert metadata handling ()
Proper null handling in Aggregation functions for SV data types ()
Add support for IAM role based credentials in Kinesis Plugin ()
Task genrator debug api ()
Add Segment Lineage List API ()
[colocated-join] Adds Support for instancePartitionsMap in Table Config ()
Support pause/resume consumption of realtime tables ()
Minion tab in Pinot UI ()
Add Protocol Buffer Stream Decoder ()
Update minion task metadata ZNode path ()
add /tasks/{taskType}/{tableNameWithType}/debug API ()
Defined a new broker metric for total query processing time ()
Proper null handling in SELECT, ORDER BY, DISTINCT, and GROUP BY ()
fixing REGEX OPTION parser ()
Enable key value byte stitching in PulsarMessageBatch ()
Add property to skip adding hadoop jars to package ()
Support DISTINCT on multiple MV columns ()
Implement Mutable FST Index ()
Support DISTINCT on single MV column ()
Add controller API for reload segment task status ()
Spark Connector, support for TIMESTAMP and BOOLEAN fields ()
Allow moveToFinalLocation in METADATA push based on config () ()
allow up to 4GB per bitmap index ()
Deprecate debug options and always use query options ()
Streamed segment download & untar with rate limiter to control disk usage ()
Improve the Explain Plan accuracy ()
allow to set https as the default scheme ()
Add histogram aggregation function ()
Allow table name with dots by a PinotConfiguration switch ()
Disable Groovy function by default ()
Deduplication ()
Add pluggable client auth provider ()
Adding pinot file system command ()
Allow broker to automatically rewrite expensive function to its approximate counterpart ()
allow to take data outside the time window by negating the window filter ()
Support BigDecimal raw value forward index; Support BigDecimal in many transforms and operators ()
Ingestion Aggregation Feature ()
Enable uploading segments to realtime tables ()
Package kafka 0.9 shaded jar to pinot-distribution ()
Simplify the parameters for DistinctCountSmartHLLAggregationFunction ()
Add PercentileSmartTDigestAggregationFunction ()
Add support for Spark 3.x ()
Adding DML definition and parse SQL InsertFile ()
endpoints to get and delete minion task metadata ()
Add query option to use more replica groups ()
Only discover public methods annotated with @ScalarFunction ()
Support single-valued BigDecimal in schema, type conversion, SQL statements and minimum set of transforms. ()
Add connection based FailureDetector ()
Add endpoints for some finer control on minion tasks ()
Add adhoc minion task creation endpoint ()
Rewrite PinotQuery based on expression hints at instance/segment level ()
Allow disabling dict generation for High cardinality columns ()
add segment size metric on segment push ()
Implement Native Text Operator ()
Change default memory allocation for consuming segments from on-heap to off-heap ()
New Pinot storage metrics for compressed tar.gz and table size w/o replicas ()
add a experiment API for upsert heap memory estimation ()
Timestamp type index ()
Upgrade Helix to 1.0.4 in Pinot ()
Allow overriding expression in query through query config ()
Always handle null time values ()
Add prefixesToRename config for renaming fields upon ingestion ()
Added multi column partitioning for offline table ()
Automatically update broker resource on broker changes ()
Upgrade protobuf as the current version has security vulnerability ()
Upgrade to hadoop 2.10.1 due to cves ()
Upgrade Helix to 1.0.4 ()
Upgrade thrift to 0.15.0 ()
Upgrade jetty due to security issue ()
Upgrade netty ()
Upgrade snappy version ()
Fix the race condition of reflection scanning classes ()
Fix ingress manifest for controller and broker ()
Fix jvm processors count ()
Fix grpc query server not setting max inbound msg size ()
Fix upsert replace ()
Fix the race condition for partial upsert record read ()
Fix log msg, as it missed one param value ()
Fix authentication issue when auth annotation is not required ()
Fix segment pruning that can break server subquery ()
Fix the NPE for ADLSGen2PinotFS ()
Fix cross merge ()
Fix LaunchDataIngestionJobCommand auth header ()
Fix catalog skipping ()
Fix adding util for getting URL from InstanceConfig ()
Fix string length in MutableColumnStatistics ()
Fix instance details page loading table for tenant ()
Fix thread safety issue with java client ()
Fix allSegmentLoaded check ()
Fix bug in segmentDetails table name parsing; style the new indexes table ()
Fix pulsar close bug ()
Fix REGEX OPTION parser ()
Avoid reporting negative values for server latency. ()
Fix getConfigOverrides in MinionQuickstart ()
Fix segment generation error handling ()
Fix multi stage engine serde ()
Fix server discovery ()
Fix Upsert config validation to check for metrics aggregation ()
Fix multi value column index creation ()
Fix grpc port assignment in multiple server quickstart ()
Spark Connector GRPC reader fix for reading realtime tables ()
Fix auth provider for minion ()
Fix metadata push mode in IngestionUtils ()
Misc fixes on segment validation for uploaded real-time segments ()
Fix a typo in ServerInstance.startQueryServer() ()
Fix the issue of server opening up query server prematurely ()
Fix regression where case order was reversed, add regression test ()
Fix dimension table load when server restart or reload table ()
Fix when there're two index filter operator h3 inclusion index throw exception ()
Fix the race condition of reading time boundary info ()
Fix pruning in expressions by max/min/bloom ()
Fix GcsPinotFs listFiles by using bucket directly ()
Fix column data type store for data table ()
Fix the potential NPE for timestamp index rewrite ()
Fix on timeout string format in KinesisDataProducer ()
Fix bug in segment rebalance with replica group segment assignment ()
Fix the upsert metadata bug when adding segment with same comparison value ()
Fix the deadlock in ClusterChangeMediator ()
Fix BigDecimal ser/de on negative scale ()
Fix table creation bug for invalid realtime consumer props ()
Fix the bug of missing dot to extract sub props from ingestion job filesytem spec and minion segmentNameGeneratorSpec ()
Fix to query inconsistencies under heavy upsert load (resolves ) ()
Fix ChildTraceId when using multiple child threads, make them unique ()
Fix the group-by reduce handling when query times out ()
Fix a typo in BaseBrokerRequestHandler ()
Fix TIMESTAMP data type usage during segment creation ()
Fix async-profiler install ()
Fix ingestion transform config bugs. ()
Fix upsert inconsistency by snapshotting the validDocIds before reading the numDocs ()
Fix bug when importing files with the same name in different directories ()
Fix the missing NOT handling ()
Fix setting of metrics compression type in RealtimeSegmentConverter ()
Fix segment status checker to skip push in-progress segments ()
Fix datetime truncate for multi-day ()
Fix redirections for routes with access-token ()
Fix CSV files surrounding space issue ()
Fix suppressed exceptions in GrpcBrokerRequestHandler()
select * FROM foo where text_col LIKE 'a%'
select * from foo where text_col CONTAINS 'bar'
Add support for Spark 3.x ()
Add Flink Pinot connector ()
Show running queries and cancel query by id ()
Timestamp Index ()
Native Text Indices ()
Adding DML definition and parse SQL InsertFile ()
Deduplication ()
Functions support and changes:
The full list of features introduced in this release
This release introduces some new great features, performance enhancements, UI improvements, and bug fixes which are described in details in the following sections.
The release was cut from this commit fd9c58a.
Dependency Graph
The dependency graph for plug-and-play architecture that was introduced in release 0.3.0 has been extended and now it contains new nodes for Pinot Segment SPI.
Dependency graph after introducing pinot-segment-api.
Many of the datasets are time series in nature, tracking state change of an entity over time. The granularity of recorded data points might be sparse or the events could be missing due to network and other device issues in the IOT environment. But analytics applications which are tracking the state change of these entities over time, might be querying for values at lower granularity than the metric interval.
Here is the sample data set tracking the status of parking lots in parking space.
lotId
event_time
is_occupied
We want to find out the total number of parking lots that are occupied over a period of time which would be a common use case for a company that manages parking spaces.
Let us take 30 minutes' time bucket as an example:
timeBucket/lotId
P1
P2
P3
If you look at the above table, you will see a lot of missing data for parking lots inside the time buckets. In order to calculate the number of occupied park lots per time bucket, we need gap fill the missing data.
There are two ways of gap filling the data: FILL_PREVIOUS_VALUE and FILL_DEFAULT_VALUE.
FILL_PREVIOUS_VALUE means the missing data will be filled with the previous value for the specific entity, in this case, park lot, if the previous value exists. Otherwise, it will be filled with the default value.
FILL_DEFAULT_VALUE means that the missing data will be filled with the default value. For numeric column, the defaul value is 0. For Boolean column type, the default value is false. For TimeStamp, it is January 1, 1970, 00:00:00 GMT. For STRING, JSON and BYTES, it is empty String. For Array type of column, it is empty array.
We will leverage the following the query to calculate the total occupied parking lots per time bucket.
The most nested sql will convert the raw event table to the following table.
lotId
event_time
is_occupied
The second most nested sql will gap fill the returned data as following:
timeBucket/lotId
P1
P2
P3
The outermost query will aggregate the gapfilled data as follows:
timeBucket
totalNumOfOccuppiedSlots
There is one assumption we made here that the raw data is sorted by the timestamp. The Gapfill and Post-Gapfill Aggregation will not sort the data.
The above example just shows the use case where the three steps happen:
The raw data will be aggregated;
The aggregated data will be gapfilled;
The gapfilled data will be aggregated.
There are three more scenarios we can support.
If we want to gapfill the missing data per half an hour time bucket, here is the query:
At first the raw data will be transformed as follows:
lotId
event_time
is_occupied
Then it will be gapfilled as follows:
lotId
event_time
is_occupied
The nested sql will convert the raw event table to the following table.
lotId
event_time
is_occupied
The outer sql will gap fill the returned data as following:
timeBucket/lotId
P1
P2
P3
The raw data will be transformed as following at first:
lotId
event_time
is_occupied
The transformed data will be gap filled as follows:
lotId
event_time
is_occupied
The aggregation will generate the following table:
timeBucket
totalNumOfOccuppiedSlots
0,1
2021-10-01 10:00:00.000
0,1
1
2021-10-01 10:30:00.000
0
2021-10-01 11:00:00.000
0
2021-10-01 11:30:00.000
0
P1
2021-10-01 09:30:00.000
1
P3
2021-10-01 10:00:00.000
1
P2
2021-10-01 10:00:00.000
1
P2
2021-10-01 10:30:00.000
0
P3
2021-10-01 11:00:00.000
0
P1
2021-10-01 11:30:00.000
0
1
1
0
2021-10-01 10:00:00.000
1
1
1
2021-10-01 10:30:00.000
1
0
1
2021-10-01 11:00:00.000
1
0
0
2021-10-01 11:30:00.000
0
0
0
2021-10-01 10:30:00.000
2
2021-10-01 11:00:00.000
1
2021-10-01 11:30:00.000
0
P1
2021-10-01 09:30:00.000
0
P1
2021-10-01 09:30:00.000
1
P3
2021-10-01 10:00:00.000
1
P2
2021-10-01 10:00:00.000
0
P2
2021-10-01 10:00:00.000
1
P2
2021-10-01 10:30:00.000
0
P3
2021-10-01 11:00:00.000
0
P1
2021-10-01 11:30:00.000
0
P3
2021-10-01 09:00:00.000
0
P1
2021-10-01 09:30:00.000
0
P1
2021-10-01 09:30:00.000
1
P2
2021-10-01 09:30:00.000
1
P3
2021-10-01 09:30:00.000
0
P1
2021-10-01 10:00:00.000
1
P3
2021-10-01 10:00:00.000
1
P2
2021-10-01 10:00:00.000
0
P2
2021-10-01 10:00:00.000
1
P1
2021-10-01 10:30:00.000
1
P2
2021-10-01 10:30:00.000
0
P3
2021-10-01 10:30:00.000
1
P1
2021-10-01 11:00:00.000
1
P2
2021-10-01 11:00:00.000
0
P3
2021-10-01 11:00:00.000
0
P1
2021-10-01 11:30:00.000
0
P2
2021-10-01 11:30:00.000
0
P3
2021-10-01 11:30:00.000
0
P1
2021-10-01 09:30:00.000
1
P3
2021-10-01 10:00:00.000
1
P2
2021-10-01 10:00:00.000
1
P2
2021-10-01 10:30:00.000
0
P3
2021-10-01 11:00:00.000
0
P1
2021-10-01 11:30:00.000
0
1
1
0
2021-10-01 10:00:00.000
1
1
1
2021-10-01 10:30:00.000
1
0
1
2021-10-01 11:00:00.000
1
0
0
2021-10-01 11:30:00.000
0
0
0
P1
2021-10-01 09:30:00.000
0
P1
2021-10-01 09:30:00.000
1
P3
2021-10-01 10:00:00.000
1
P2
2021-10-01 10:00:00.000
0
P2
2021-10-01 10:00:00.000
1
P2
2021-10-01 10:30:00.000
0
P3
2021-10-01 11:00:00.000
0
P1
2021-10-01 11:30:00.000
0
P3
2021-10-01 09:00:00.000
0
P1
2021-10-01 09:30:00.000
0
P1
2021-10-01 09:30:00.000
1
P2
2021-10-01 09:30:00.000
1
P3
2021-10-01 09:30:00.000
0
P1
2021-10-01 10:00:00.000
1
P3
2021-10-01 10:00:00.000
1
P2
2021-10-01 10:00:00.000
0
P2
2021-10-01 10:00:00.000
1
P1
2021-10-01 10:30:00.000
1
P2
2021-10-01 10:30:00.000
0
P3
2021-10-01 10:30:00.000
1
P2
2021-10-01 10:30:00.000
0
P1
2021-10-01 11:00:00.000
1
P2
2021-10-01 11:00:00.000
0
P3
2021-10-01 11:00:00.000
0
P1
2021-10-01 11:30:00.000
0
P2
2021-10-01 11:30:00.000
0
P3
2021-10-01 11:30:00.000
0
2021-10-01 10:30:00.000
2
2021-10-01 11:00:00.000
1
2021-10-01 11:30:00.000
0
P1
2021-10-01 09:01:00.000
1
P2
2021-10-01 09:17:00.000
1
P1
2021-10-01 09:33:00.000
0
P1
2021-10-01 09:47:00.000
1
P3
2021-10-01 10:05:00.000
1
P2
2021-10-01 10:06:00.000
0
P2
2021-10-01 10:16:00.000
1
P2
2021-10-01 10:31:00.000
0
P3
2021-10-01 11:17:00.000
0
P1
2021-10-01 11:54:00.000
0
2021-10-01 09:00:00.000
1
1
P1
2021-10-01 09:00:00.000
1
P2
2021-10-01 09:00:00.000
2021-10-01 09:00:00.000
1
1
0
2021-10-01 09:00:00.000
2
2021-10-01 09:30:00.000
2
2021-10-01 10:00:00.000
P1
2021-10-01 09:00:00.000
1
P2
2021-10-01 09:00:00.000
P1
2021-10-01 09:00:00.000
1
P2
2021-10-01 09:00:00.000
P1
2021-10-01 09:00:00.000
1
P2
2021-10-01 09:00:00.000
2021-10-01 09:00:00.000
1
1
0
P1
2021-10-01 09:00:00.000
1
P2
2021-10-01 09:00:00.000
P1
2021-10-01 09:00:00.000
1
P2
2021-10-01 09:00:00.000
2021-10-01 09:00:00.000
2
2021-10-01 09:30:00.000
2
2021-10-01 10:00:00.000
The Ways of Gap Filling the Data
Aggregation/Gapfill/Aggregation
Query Syntax
Workflow
Select/Gapfill
Query Syntax
Workflow
Aggregate/Gapfill
Query Syntax
Workflow
Gapfill/Aggregate
Query Syntax
Workflow
2021-10-01 09:30:00.000
1
2021-10-01 09:30:00.000
3
1
1
1
2021-10-01 09:30:00.000
1
1
3
SELECT time_col, SUM(status) AS occupied_slots_count
FROM (
SELECT GAPFILL(time_col,'1:MILLISECONDS:SIMPLE_DATE_FORMAT:yyyy-MM-dd HH:mm:ss.SSS','2021-10-01 09:00:00.000',
'2021-10-01 12:00:00.000','30:MINUTES', FILL(status, 'FILL_PREVIOUS_VALUE'),
TIMESERIESON(lotId)), lotId, status
FROM (
SELECT DATETIMECONVERT(event_time,'1:MILLISECONDS:EPOCH',
'1:MILLISECONDS:SIMPLE_DATE_FORMAT:yyyy-MM-dd HH:mm:ss.SSS','30:MINUTES') AS time_col,
lotId, lastWithTime(is_occupied, event_time, 'INT') AS status
FROM parking_data
WHERE event_time >= 1633078800000 AND event_time <= 1633089600000
GROUP BY 1, 2
ORDER BY 1
LIMIT 100)
LIMIT 100)
GROUP BY 1
LIMIT 100
SELECT GAPFILL(DATETIMECONVERT(event_time,'1:MILLISECONDS:EPOCH',
'1:MILLISECONDS:SIMPLE_DATE_FORMAT:yyyy-MM-dd HH:mm:ss.SSS','30:MINUTES'),
'1:MILLISECONDS:SIMPLE_DATE_FORMAT:yyyy-MM-dd HH:mm:ss.SSS','2021-10-01 09:00:00.000',
'2021-10-01 12:00:00.000','30:MINUTES', FILL(is_occupied, 'FILL_PREVIOUS_VALUE'),
TIMESERIESON(lotId)) AS time_col, lotId, is_occupied
FROM parking_data
WHERE event_time >= 1633078800000 AND event_time <= 1633089600000
ORDER BY 1
LIMIT 100
SELECT GAPFILL(time_col,'1:MILLISECONDS:SIMPLE_DATE_FORMAT:yyyy-MM-dd HH:mm:ss.SSS','2021-10-01 09:00:00.000',
'2021-10-01 12:00:00.000','30:MINUTES', FILL(status, 'FILL_PREVIOUS_VALUE'),
TIMESERIESON(lotId)), lotId, status
FROM (
SELECT DATETIMECONVERT(event_time,'1:MILLISECONDS:EPOCH',
'1:MILLISECONDS:SIMPLE_DATE_FORMAT:yyyy-MM-dd HH:mm:ss.SSS','30:MINUTES') AS time_col,
lotId, lastWithTime(is_occupied, event_time, 'INT') AS status
FROM parking_data
WHERE event_time >= 1633078800000 AND event_time <= 1633089600000
GROUP BY 1, 2
ORDER BY 1
LIMIT 100)
LIMIT 100
SELECT time_col, SUM(is_occupied) AS occupied_slots_count
FROM (
SELECT GAPFILL(DATETIMECONVERT(event_time,'1:MILLISECONDS:EPOCH',
'1:MILLISECONDS:SIMPLE_DATE_FORMAT:yyyy-MM-dd HH:mm:ss.SSS','30:MINUTES'),
'1:MILLISECONDS:SIMPLE_DATE_FORMAT:yyyy-MM-dd HH:mm:ss.SSS','2021-10-01 09:00:00.000',
'2021-10-01 12:00:00.000','30:MINUTES', FILL(is_occupied, 'FILL_PREVIOUS_VALUE'),
TIMESERIESON(lotId)) AS time_col, lotId, is_occupied
FROM parking_data
WHERE event_time >= 1633078800000 AND event_time <= 1633089600000
ORDER BY 1
LIMIT 100)
GROUP BY 1
LIMIT 100
Servers host the data segments and serve queries off the data they host. There are two types of servers:
Offline
Offline servers are responsible for downloading segments from the segment store, to host and serve queries off. When a new segment is uploaded to the controller, the controller decides the servers (as many as replication) that will host the new segment and notifies them to download the segment from the segment store. On receiving this notification, the servers download the segment file and load the segment onto the server, to server queries off them.
Real-time
Real-time servers directly ingest from a real-time stream (such as Kafka, EventHubs). Periodically, they make segments of the in-memory ingested data, based on certain thresholds. This segment is then persisted onto the segment store.
Pinot Servers are modeled as Helix Participants, hosting Pinot tables (referred to as resources in Helix terminology). Segments of a table are modeled as Helix partitions (of a resource). Thus, a Pinot server hosts one or more helix partitions of one or more helix resources (i.e. one or more segments of one or more tables).
Make sure you've . If you're using docker, make sure to . To start a server
USAGE
Usage: StartServer
-serverHost <String> : Host name for controller. (required=false)
-serverPort <int> : Port number to start the server at. (required=false)
-serverAdminPort <int> : Port number to serve the server admin API at. (required=false)
-dataDir <string> : Path to directory containing data. (required=false)
-segmentDir <string> : Path to directory containing segments. (required=false)
-zkAddress <http> : Http address of Zookeeper. (required=false)
-clusterName <String> : Pinot cluster name. (required=false)
-configFileName <Config File Name> : Broker Starter Config file. (required=false)
-help : Print this message. (required=false)
Usage: StartServer
-serverHost <String> : Host name for controller. (required=false)
-serverPort <int> : Port number to start the server at. (required=false)
-serverAdminPort <int> : Port number to serve the server admin API at. (required=false)
-dataDir <string> : Path to directory containing data. (required=false)
-segmentDir <string> : Path to directory containing segments. (required=false)
-zkAddress <http> : Http address of Zookeeper. (required=false)
-clusterName <String> : Pinot cluster name. (required=false)
-configFileName <Config File Name> : Server Starter Config file. (required=false)
-help : Print this message. (required=false)