Learn to build and manage Apache Pinot clusters, uncovering key components for efficient data processing and optimized analysis.
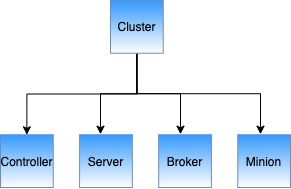
A cluster is a set of nodes comprising of servers, brokers, controllers and minions.
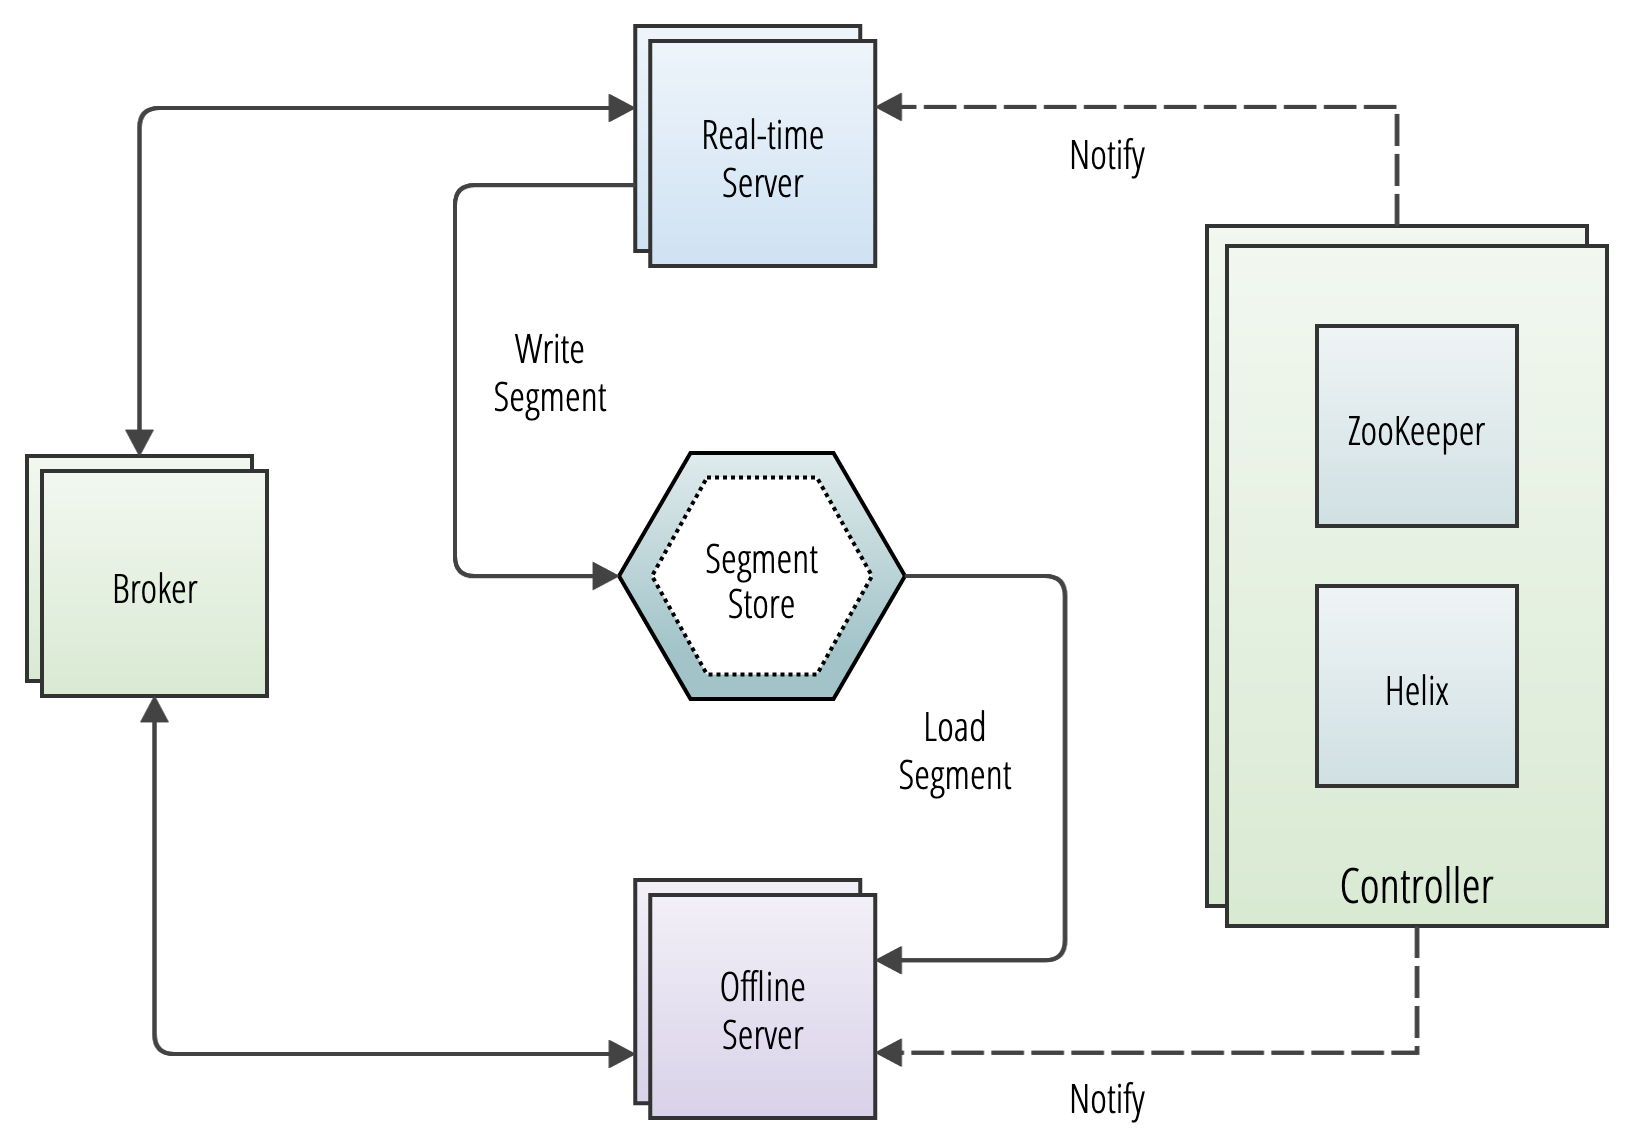
Pinot cluster components
Pinot uses Apache Helix for cluster management. Helix is a cluster management framework that manages replicated, partitioned resources in a distributed system. Helix uses Zookeeper to store cluster state and metadata.
Cluster configuration
For details of cluster configuration settings, see .
Cluster components
Helix divides nodes into logical components based on their responsibilities:
Participant
Participants are the nodes that host distributed, partitioned resources
Pinot servers are modeled as participants. For details about server nodes, see .
Spectator
Spectators are the nodes that observe the current state of each participant and use that information to access the resources. Spectators are notified of state changes in the cluster (state of a participant, or that of a partition in a participant).
Pinotbrokers are modeled as spectators. For details about broker nodes, see .
Controller
The node that observes and controls the Participant nodes. It is responsible for coordinating all transitions in the cluster and ensuring that state constraints are satisfied while maintaining cluster stability.
Pinot controllers are modeled as controllers. For details about controller nodes, see .
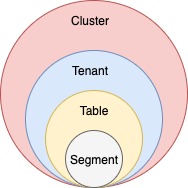
Logical view
Another way to visualize the cluster is a logical view, where:
A cluster contains
Tenants contain
Tables contain
Set up a Pinot cluster
Typically, there is only one cluster per environment/data center. There is no need to create multiple Pinot clusters because Pinot supports .
To set up a cluster, see one of the following guides:
Discover the core components of Apache Pinot, enabling efficient data processing and analytics. Unleash the power of Pinot's building blocks for high-performance data-driven applications.
Pages in this section define and describe the major components and logical abstractions used in Pinot.
For a general overview that ties all these components together, see Basic Concepts.
Discover the tenant component of Apache Pinot, which facilitates efficient data isolation and resource management within Pinot clusters.
A tenant is a logical component defined as a group of server/broker nodes with the same Helix tag.
In order to support multi-tenancy, Pinot has first-class support for tenants. Every table is associated with a server tenant and a broker tenant. This controls the nodes that will be used by this table as servers and brokers. This allows all tables belonging to a particular use case to be grouped under a single tenant name.
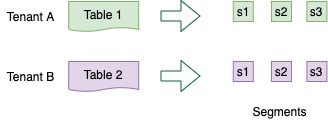
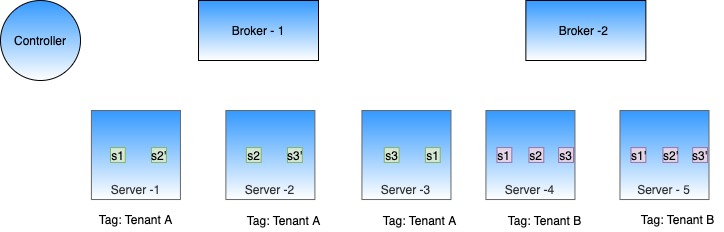
The concept of tenants is very important when the multiple use cases are using Pinot and there is a need to provide quotas or some sort of isolation across tenants. For example, consider we have two tables Table A and Table B in the same Pinot cluster.
Defining tenants for tables
We can configure Table A with server tenant Tenant A and Table B with server tenant Tenant B. We can tag some of the server nodes for Tenant A and some for Tenant B. This will ensure that segments of Table A only reside on servers tagged with Tenant A, and segment of Table B only reside on servers tagged with Tenant B. The same isolation can be achieved at the broker level, by configuring broker tenants to the tables.
No need to create separate clusters for every table or use case!
Tenant configuration
This tenant is defined in the section of the table config.
This section contains two main fields broker and server , which decide the tenants used for the broker and server components of this table.
In the above example:
The table will be served by brokers that have been tagged as brokerTenantName_BROKER in Helix.
If this were an offline table, the offline segments for the table will be hosted in Pinot servers tagged in Helix as serverTenantName_OFFLINE
If this were a real-time table, the real-time segments (both consuming as well as completed ones) will be hosted in pinot servers tagged in Helix as
Create a tenant
Broker tenant
Here's a sample broker tenant config. This will create a broker tenant sampleBrokerTenant by tagging three untagged broker nodes as sampleBrokerTenant_BROKER.
To create this tenant use the following command. The creation will fail if number of untagged broker nodes is less than numberOfInstances.
Follow instructions in to get Pinot locally, and then
Check out the table config in the to make sure it was successfully uploaded.
Server tenant
Here's a sample server tenant config. This will create a server tenant sampleServerTenant by tagging 1 untagged server node as sampleServerTenant_OFFLINE and 1 untagged server node as sampleServerTenant_REALTIME.
To create this tenant use the following command. The creation will fail if number of untagged server nodes is less than offlineInstances + realtimeInstances.
Follow instructions in to get Pinot locally, and then
Check out the table config in the to make sure it was successfully uploaded.
Broker
Discover how Apache Pinot's broker component optimizes query processing, data retrieval, and enhances data-driven applications.
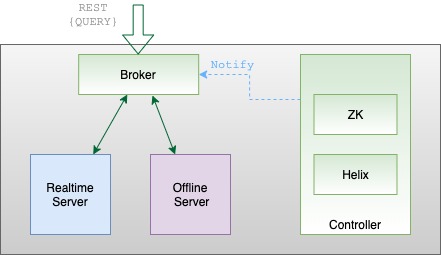
Brokers handle Pinot queries. They accept queries from clients and forward them to the right servers. They collect results back from the servers and consolidate them into a single response, to send back to the client.
Pinot brokers are modeled as Helix spectators. They need to know the location of each segment of a table (and each replica of the segments) and route requests to the appropriate server that hosts the segments of the table being queried.
The broker ensures that all the rows of the table are queried exactly once so as to return correct, consistent results for a query. The brokers may optimize to prune some of the segments as long as accuracy is not sacrificed.
Helix provides the framework by which spectators can learn the location in which each partition of a resource (i.e. participant) resides. The brokers use this mechanism to learn the servers that host specific segments of a table.
Deep Store
Leverage Apache Pinot's deep store component for efficient large-scale data storage and management, enabling impactful data processing and analysis.
The deep store (or deep storage) is the permanent store for files.
It is used for backup and restore operations. New nodes in a cluster will pull down a copy of segment files from the deep store. If the local segment files on a server gets damaged in some way (or accidentally deleted), a new copy will be pulled down from the deep store on server restart.
The deep store stores a compressed version of the segment files and it typically won't include any indexes. These compressed files can be stored on a local file system or on a variety of other file systems. For more details on supported file systems, see .
Note: Deep store by itself is not sufficient for restore operations. Pinot stores metadata such as table config, schema, segment metadata in Zookeeper. For restore operations, both Deep Store as well as Zookeeper metadata are required.
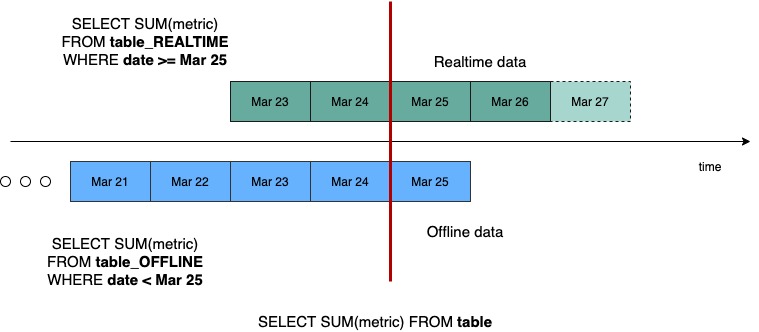
In the case of hybrid tables, the brokers ensure that the overlap between real-time and offline segment data is queried exactly once, by performing offline and real-time federation.
Let's take this example, we have real-time data for 5 days - March 23 to March 27, and offline data has been pushed until Mar 25, which is 2 days behind real-time. The brokers maintain this time boundary.
Suppose, we get a query to this table : select sum(metric) from table. The broker will split the query into 2 queries based on this time boundary – one for offline and one for real-time. This query becomes select sum(metric) from table_REALTIME where date >= Mar 25
and select sum(metric) from table_OFFLINE where date < Mar 25
The broker merges results from both these queries before returning the result to the client.
There are several different ways that segments are persisted in the deep store.
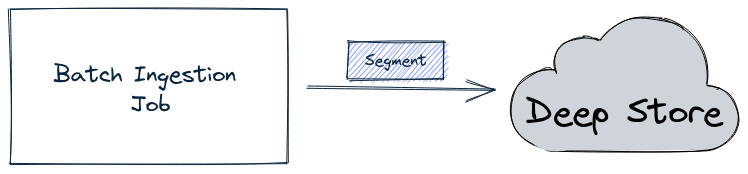
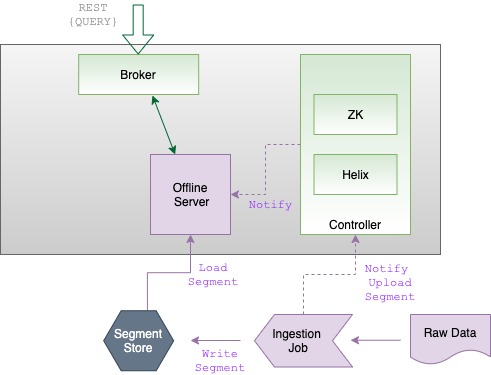
For offline tables, the batch ingestion job writes the segment directly into the deep store, as shown in the diagram below:
Batch job writing a segment into the deep store
The ingestion job then sends a notification about the new segment to the controller, which in turn notifies the appropriate server to pull down that segment.
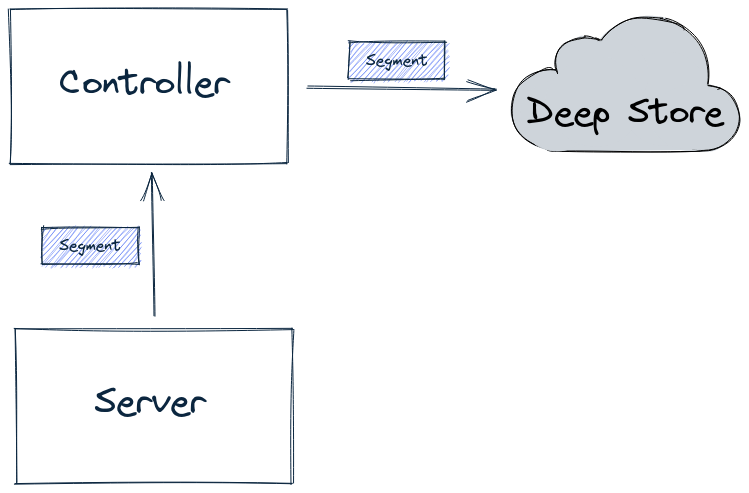
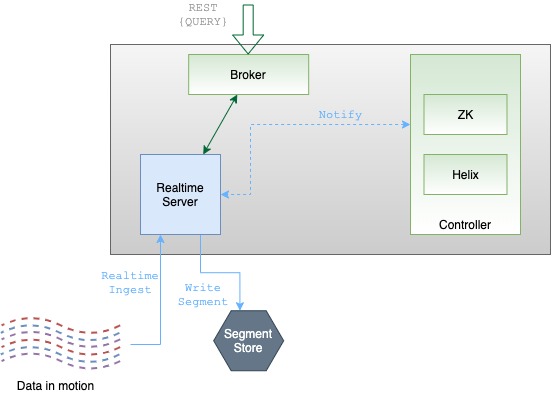
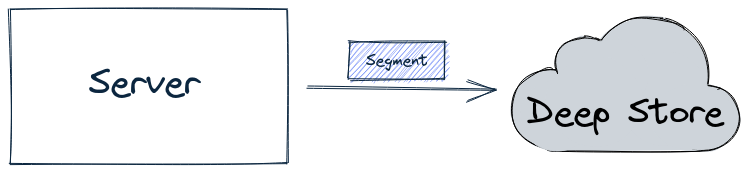
For real-time tables, by default, a segment is first built-in memory by the server. It is then uploaded to the lead controller (as part of the Segment Completion Protocol sequence), which writes the segment into the deep store, as shown in the diagram below:
Server sends segment to Controller, which writes segments into the deep store
Having all segments go through the controller can become a system bottleneck under heavy load, in which case you can use the peer download policy, as described in Decoupling Controller from the Data Path.
When using this configuration, the server will directly write a completed segment to the deep store, as shown in the diagram below:
Server writing a segment into the deep store
Configuring the deep store
For hands-on examples of how to configure the deep store, see the following tutorials:
Discover the controller component of Apache Pinot, enabling efficient data and query management.
The Pinot controller is responsible for the following:
Maintaining global metadata (e.g., configs and schemas) of the system with the help of Zookeeper which is used as the persistent metadata store.
Hosting the Helix Controller and managing other Pinot components (brokers, servers, minions)
Maintaining the mapping of which servers are responsible for which segments. This mapping is used by the servers to download the portion of the segments that they are responsible for. This mapping is also used by the broker to decide which servers to route the queries to.
Serving admin endpoints for viewing, creating, updating, and deleting configs, which are used to manage and operate the cluster.
Serving endpoints for segment uploads, which are used in offline data pushes. They are responsible for initializing real-time consumption and coordination of persisting real-time segments into the segment store periodically.
Undertaking other management activities such as managing retention of segments, validations.
For redundancy, there can be multiple instances of Pinot controllers. Pinot expects that all controllers are configured with the same back-end storage system so that they have a common view of the segments (e.g. NFS). Pinot can use other storage systems such as HDFS or .
Running the periodic task manually
The controller runs several periodic tasks in the background, to perform activities such as management and validation. Each periodic task has to define the run frequency and default frequency. Each task runs at its own schedule or can also be triggered manually if needed. The task runs on the lead controller for each table.
For period task configuration details, see .
Use the GET /periodictask/names API to fetch the names of all the periodic tasks running on your Pinot cluster.
To manually run a named periodic task, use the GET /periodictask/run API:
The Log Request Id (api-09630c07) can be used to search through pinot-controller log file to see log entries related to execution of the Periodic task that was manually run.
If tableName (and its type OFFLINE or REALTIME) is not provided, the task will run against all tables.
Starting a controller
Make sure you've . If you're using Docker, make sure to . To start a controller:
Server
Uncover the efficient data processing and storage capabilities of Apache Pinot's server component, optimizing performance for data-driven applications.
Servers host the data segments and serve queries off the data they host. There are two types of servers:
Offline
Offline servers are responsible for downloading segments from the segment store, to host and serve queries off. When a new segment is uploaded to the controller, the controller decides the servers (as many as replication) that will host the new segment and notifies them to download the segment from the segment store. On receiving this notification, the servers download the segment file and load the segment onto the server, to server queries off them.
Real-time
Real-time servers directly ingest from a real-time stream (such as Kafka or EventHubs). Periodically, they make segments of the in-memory ingested data, based on certain thresholds. This segment is then persisted onto the segment store.
Pinot servers are modeled as Helix participants, hosting Pinot tables (referred to as resources in Helix terminology). Segments of a table are modeled as Helix partitions (of a resource). Thus, a Pinot server hosts one or more Helix partitions of one or more helix resources (i.e. one or more segments of one or more tables).
Starting a server
Make sure you've . If you're using Docker, make sure to . To start a server:
Pinot Data Explorer
Pinot Data Explorer is a user-friendly interface in Apache Pinot for interactive data exploration, querying, and visualization.
Once you have set up a cluster, you can start exploring the data and the APIs using the Pinot Data Explorer.
Navigate to in your browser to open the Data Explorer UI.
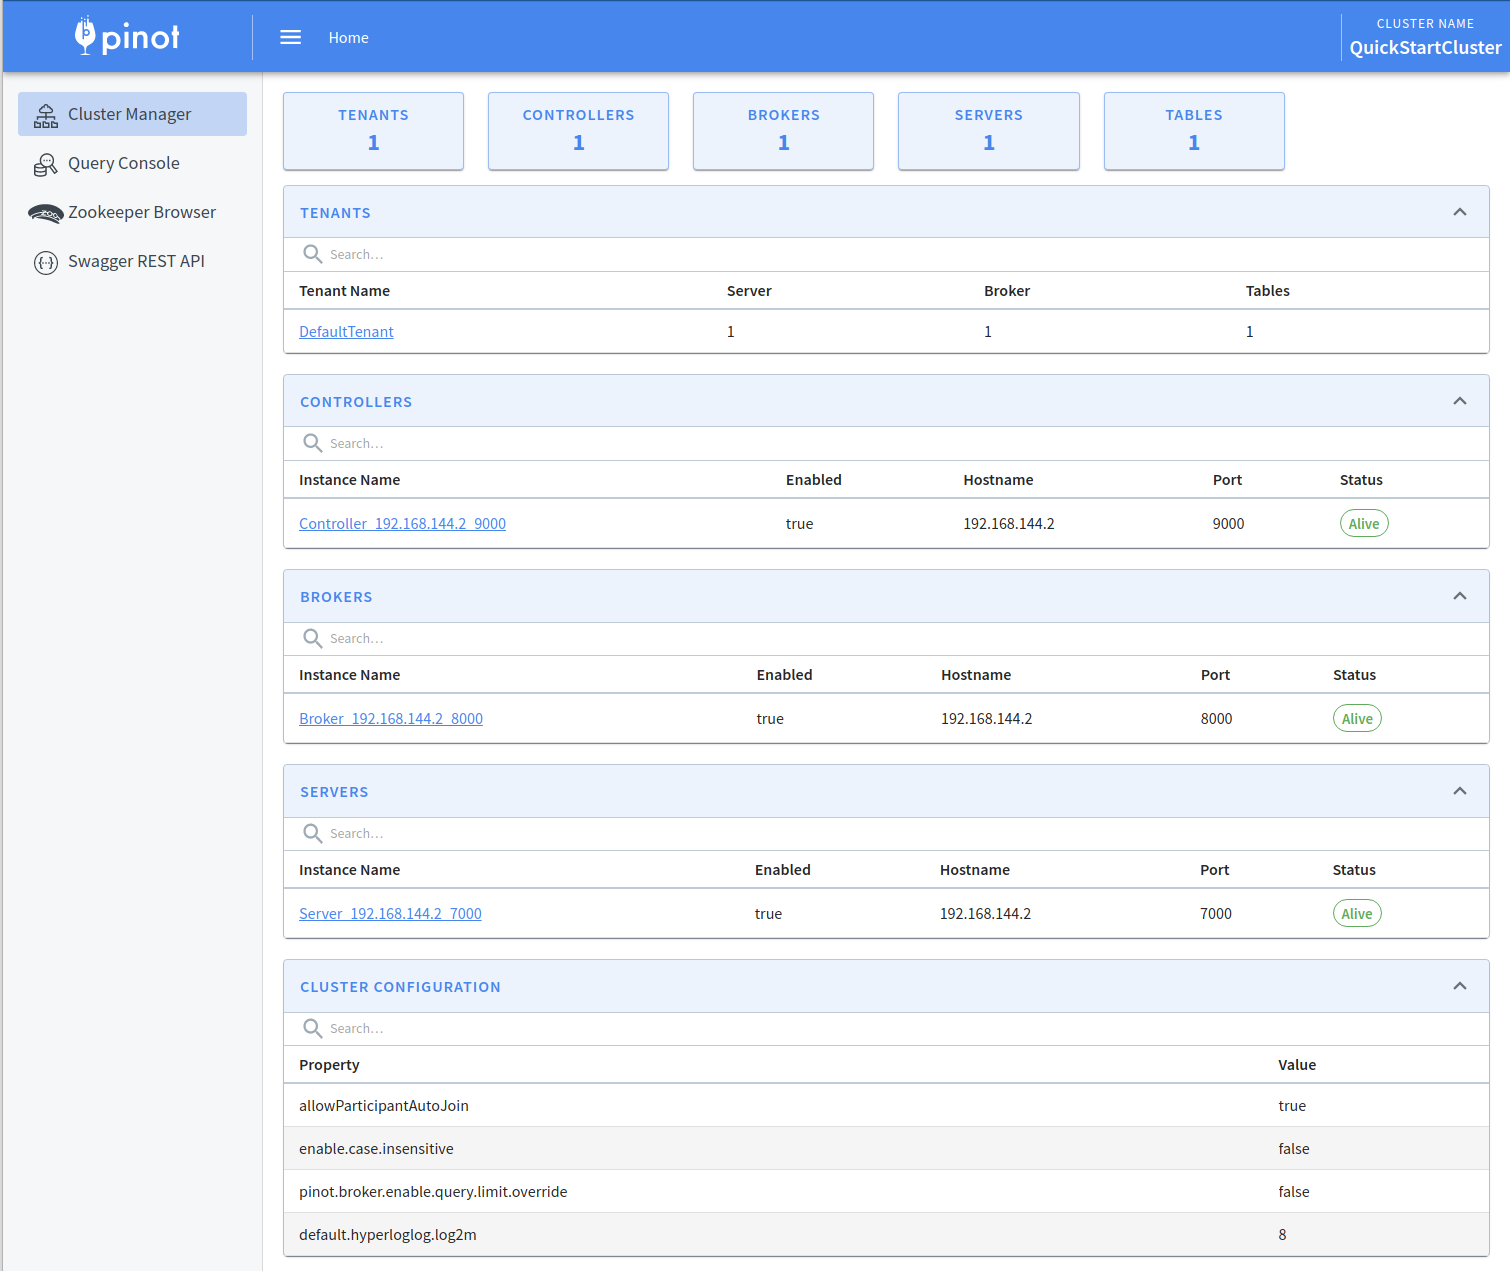
Cluster Manager
The first screen that you'll see when you open the Pinot Data Explorer is the Cluster Manager. The Cluster Manager provides a UI to operate and manage your cluster.
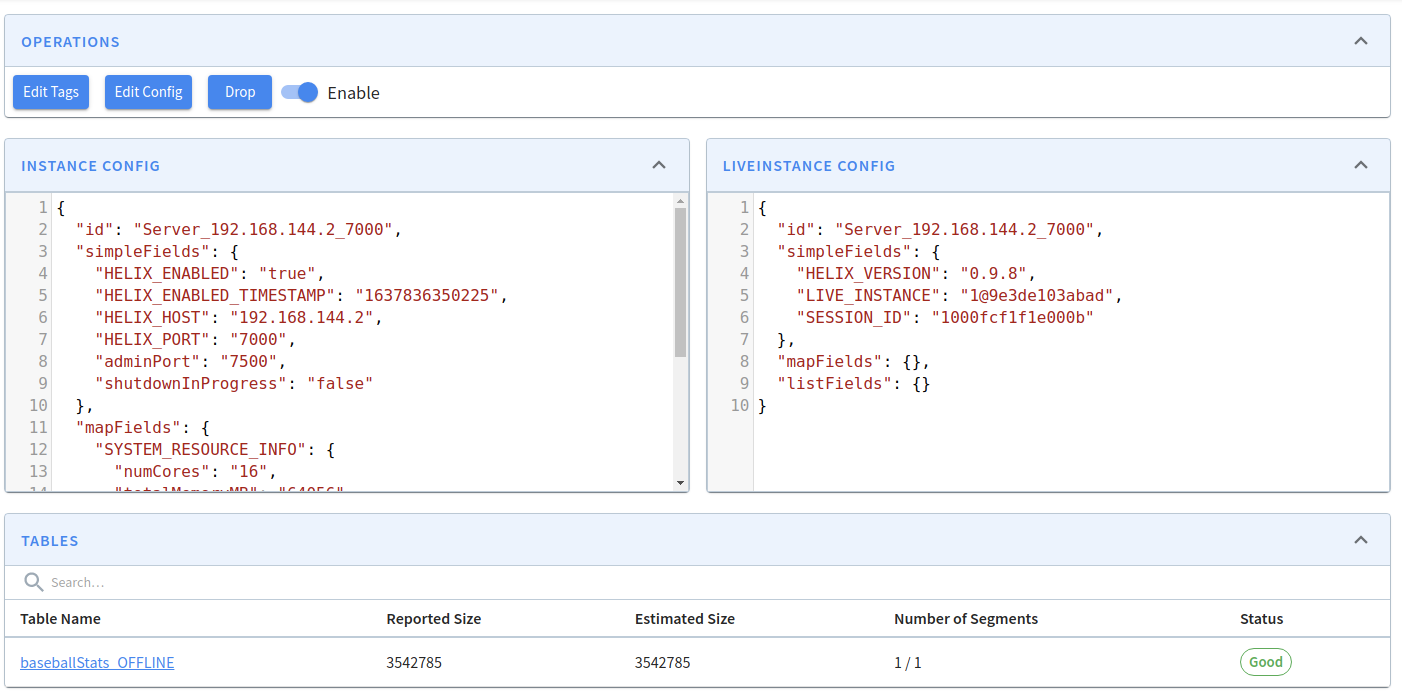
If you want to view the contents of a server, click on its instance name. You'll then see the following:
Pinot Server
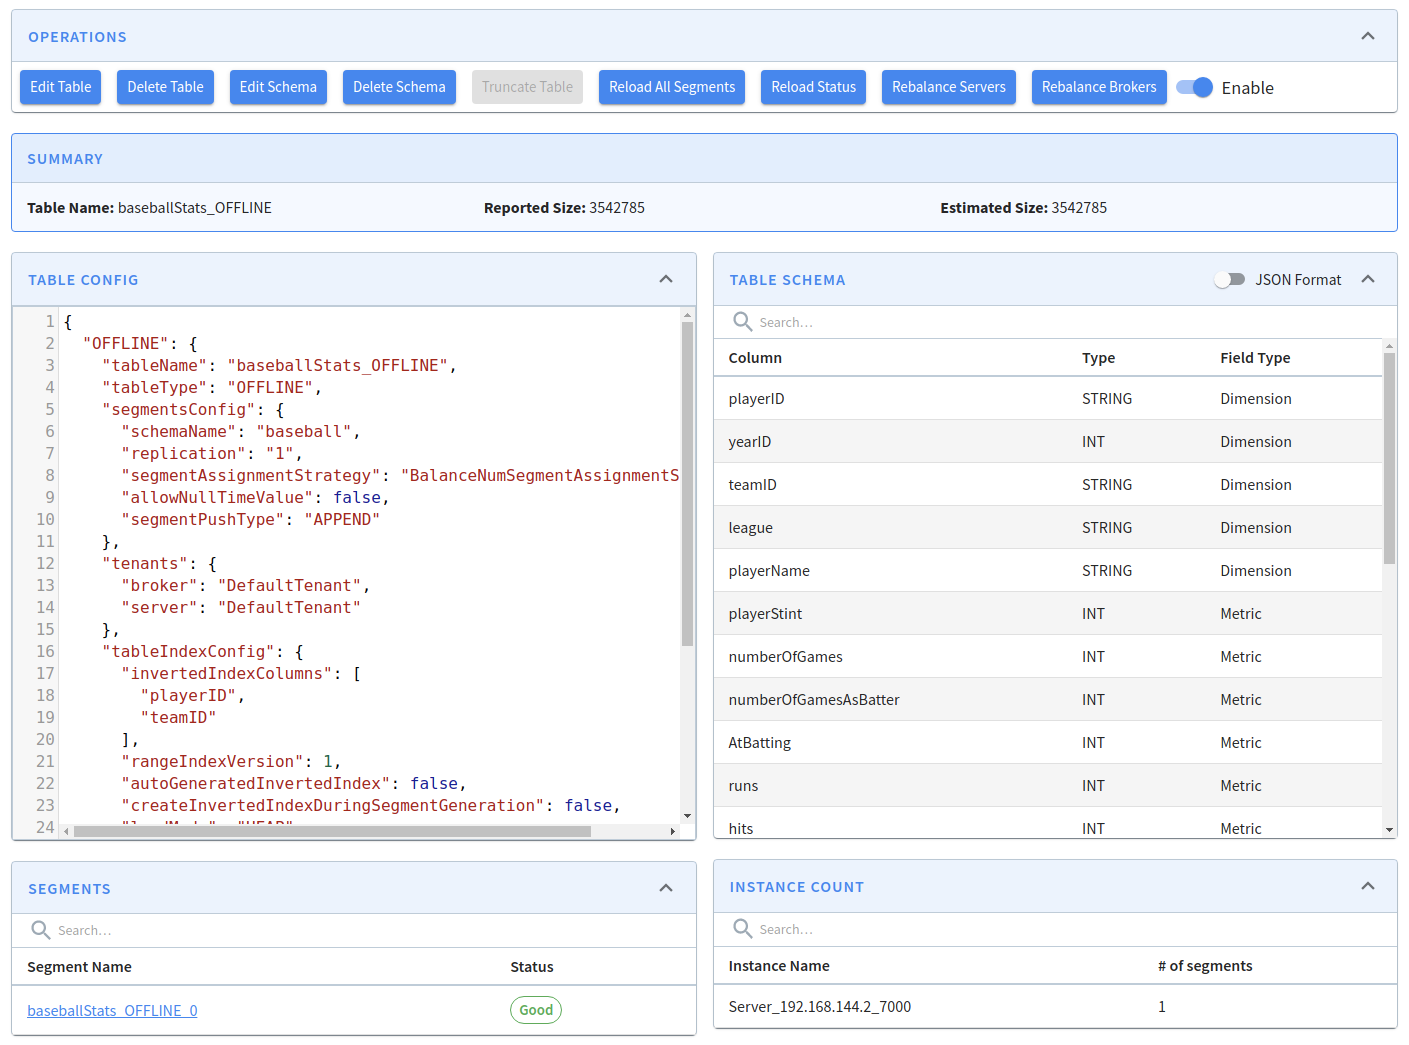
To view the baseballStats table, click on its name, which will show the following screen:
baseballStats Table
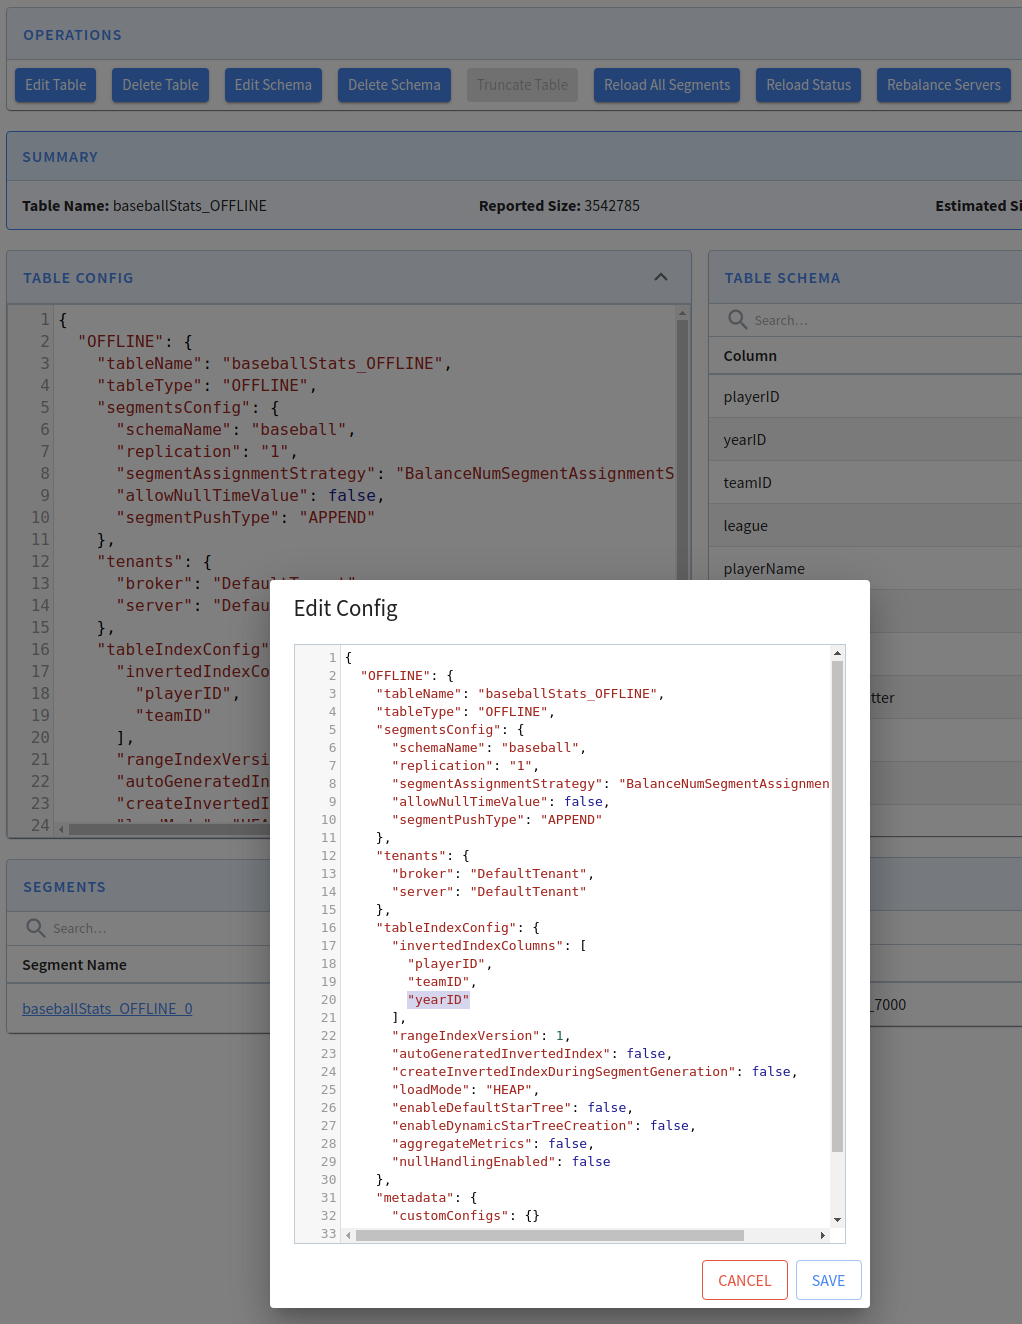
From this screen, we can edit or delete the table, edit or adjust its schema, as well as several other operations.
For example, if we want to add yearID to the list of inverted indexes, click on Edit Table, add the extra column, and click Save:
Edit Table
Query Console
Let's run some queries on the data in the Pinot cluster. Navigate to Query Console to see the querying interface.
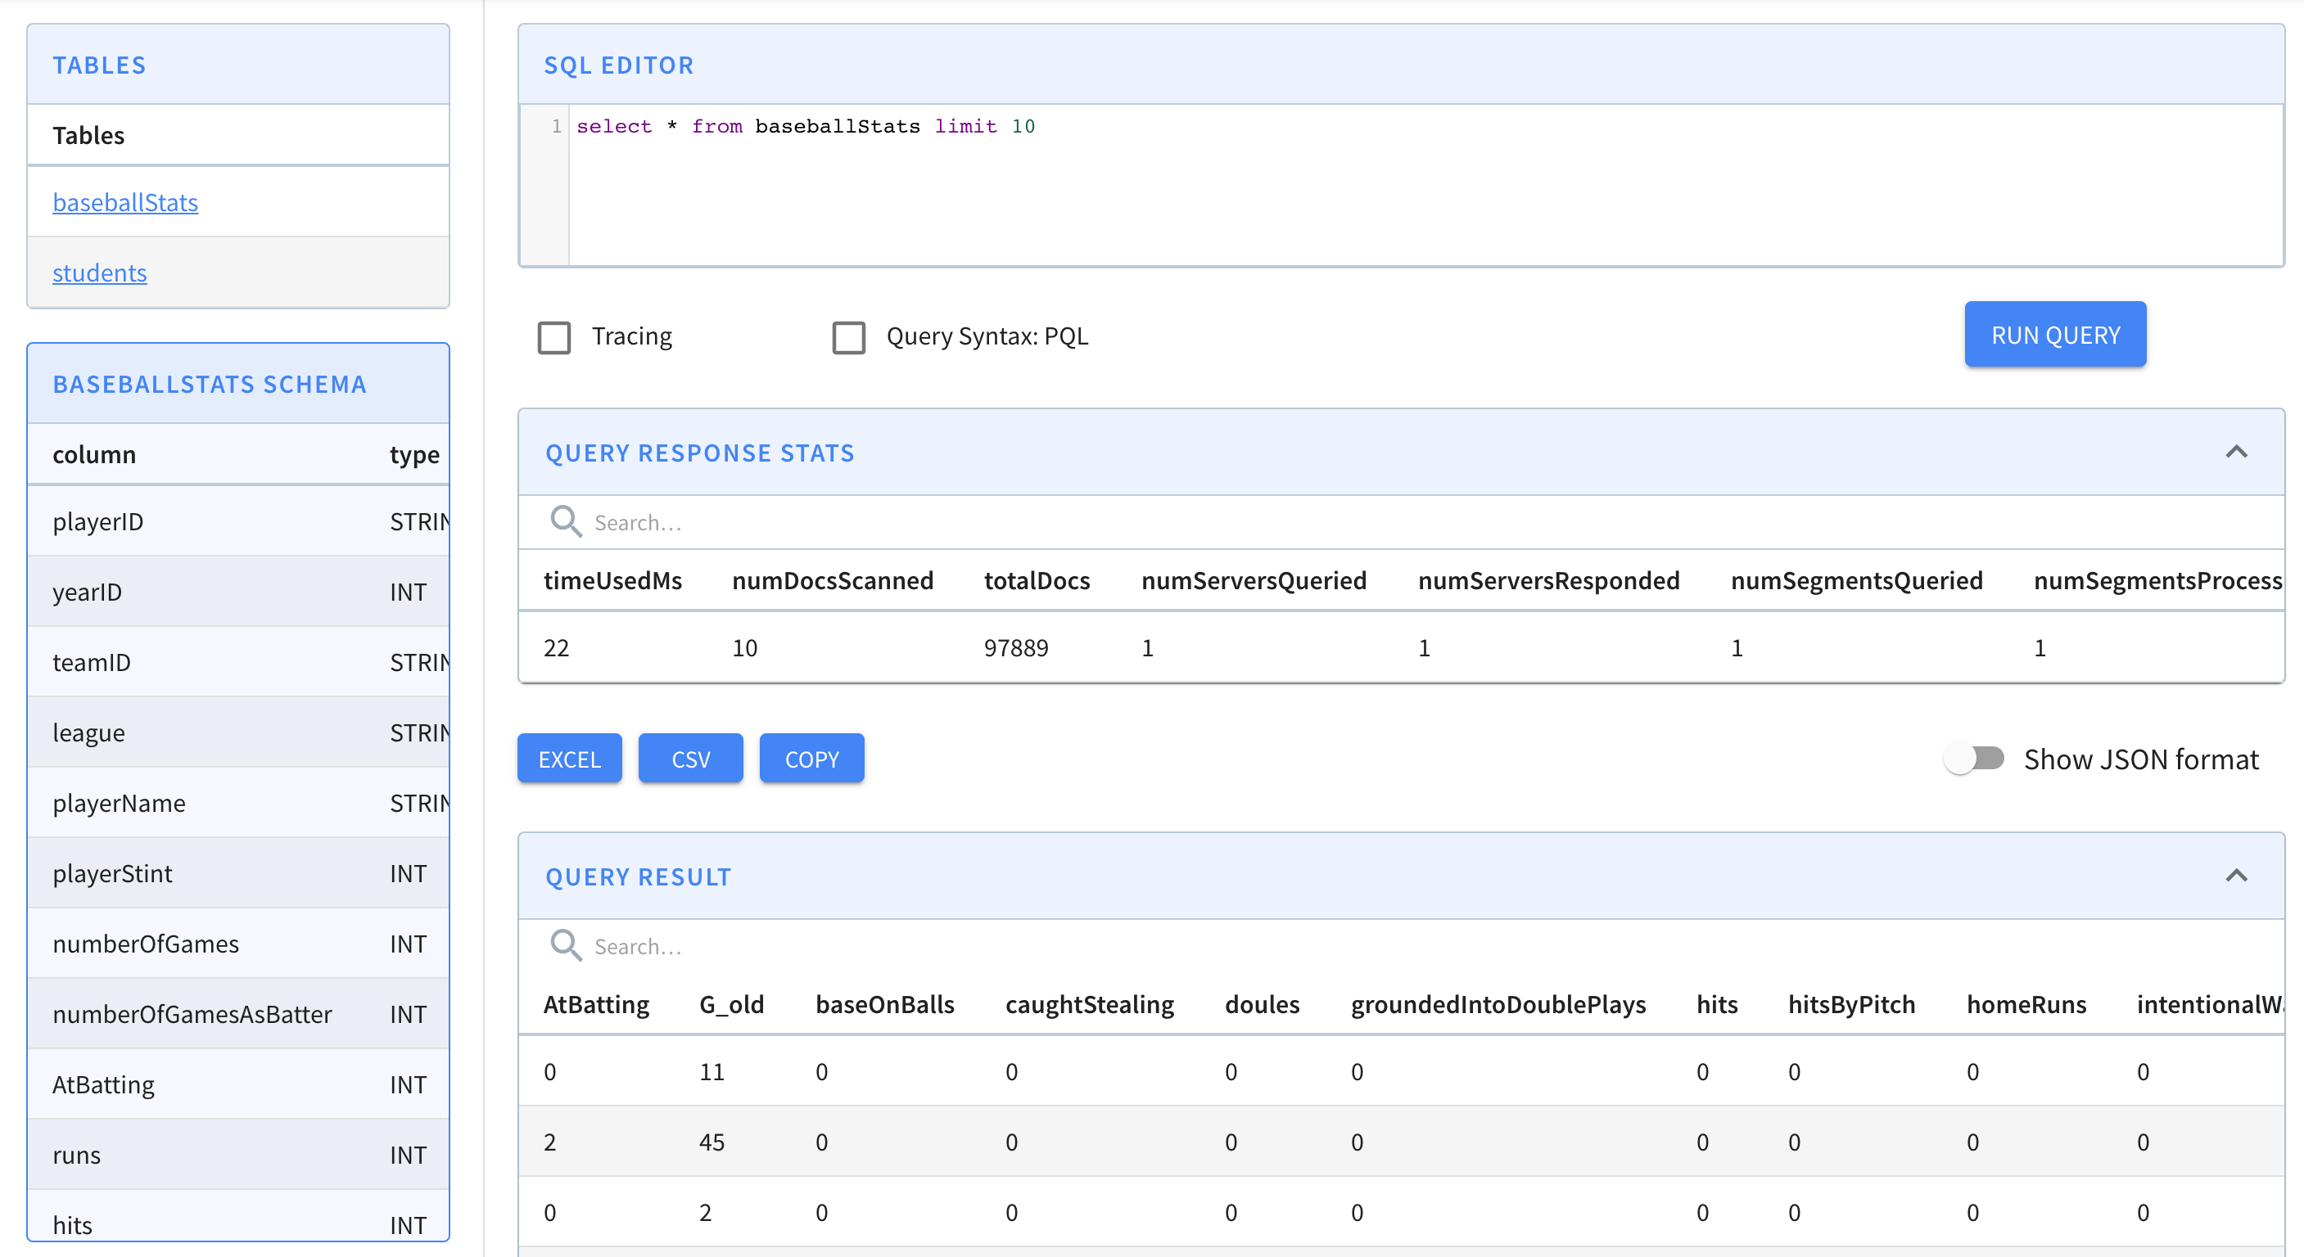
We can see our baseballStats table listed on the left (you will see meetupRSVP or airlineStats if you used the streaming or the hybrid quick start). Click on the table name to display all the names along with the data types of the columns of the table.
You can also execute a sample query select * from baseballStats limit 10 by typing it in the text box and clicking the Run Query button.
Cmd + Enter can also be used to run the query when focused on the console.
Here are some sample queries you can try:
Pinot supports a subset of standard SQL. For more information, see Pinot Query Language.
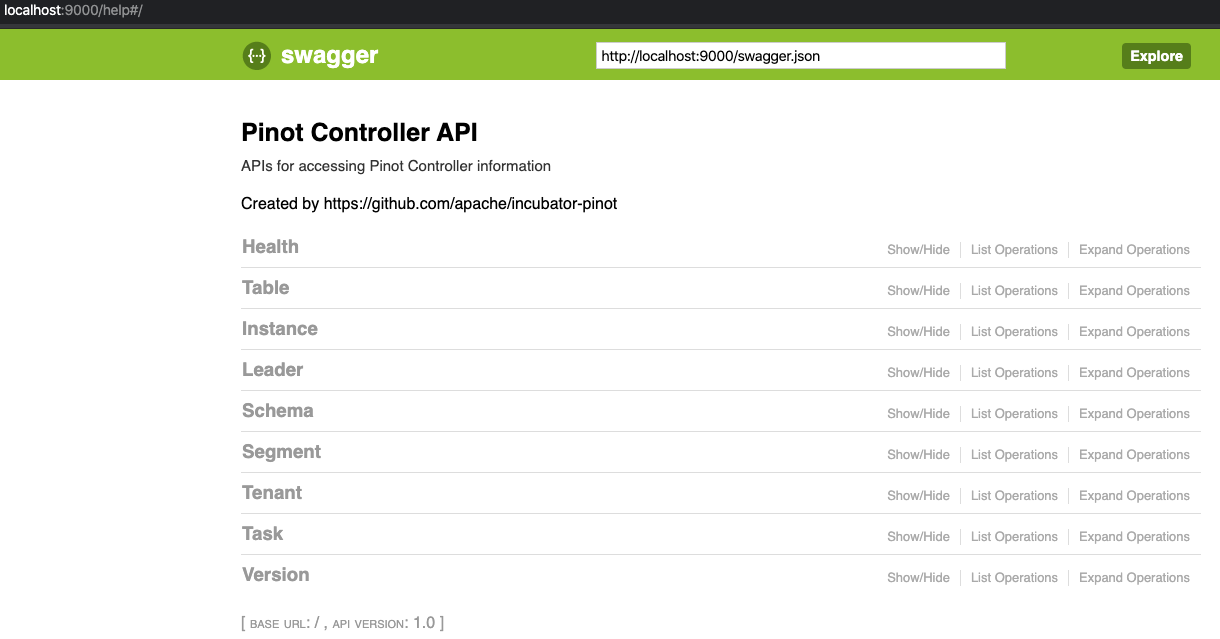
Rest API
The Pinot Admin UI contains all the APIs that you will need to operate and manage your cluster. It provides a set of APIs for Pinot cluster management including health check, instances management, schema and table management, data segments management.
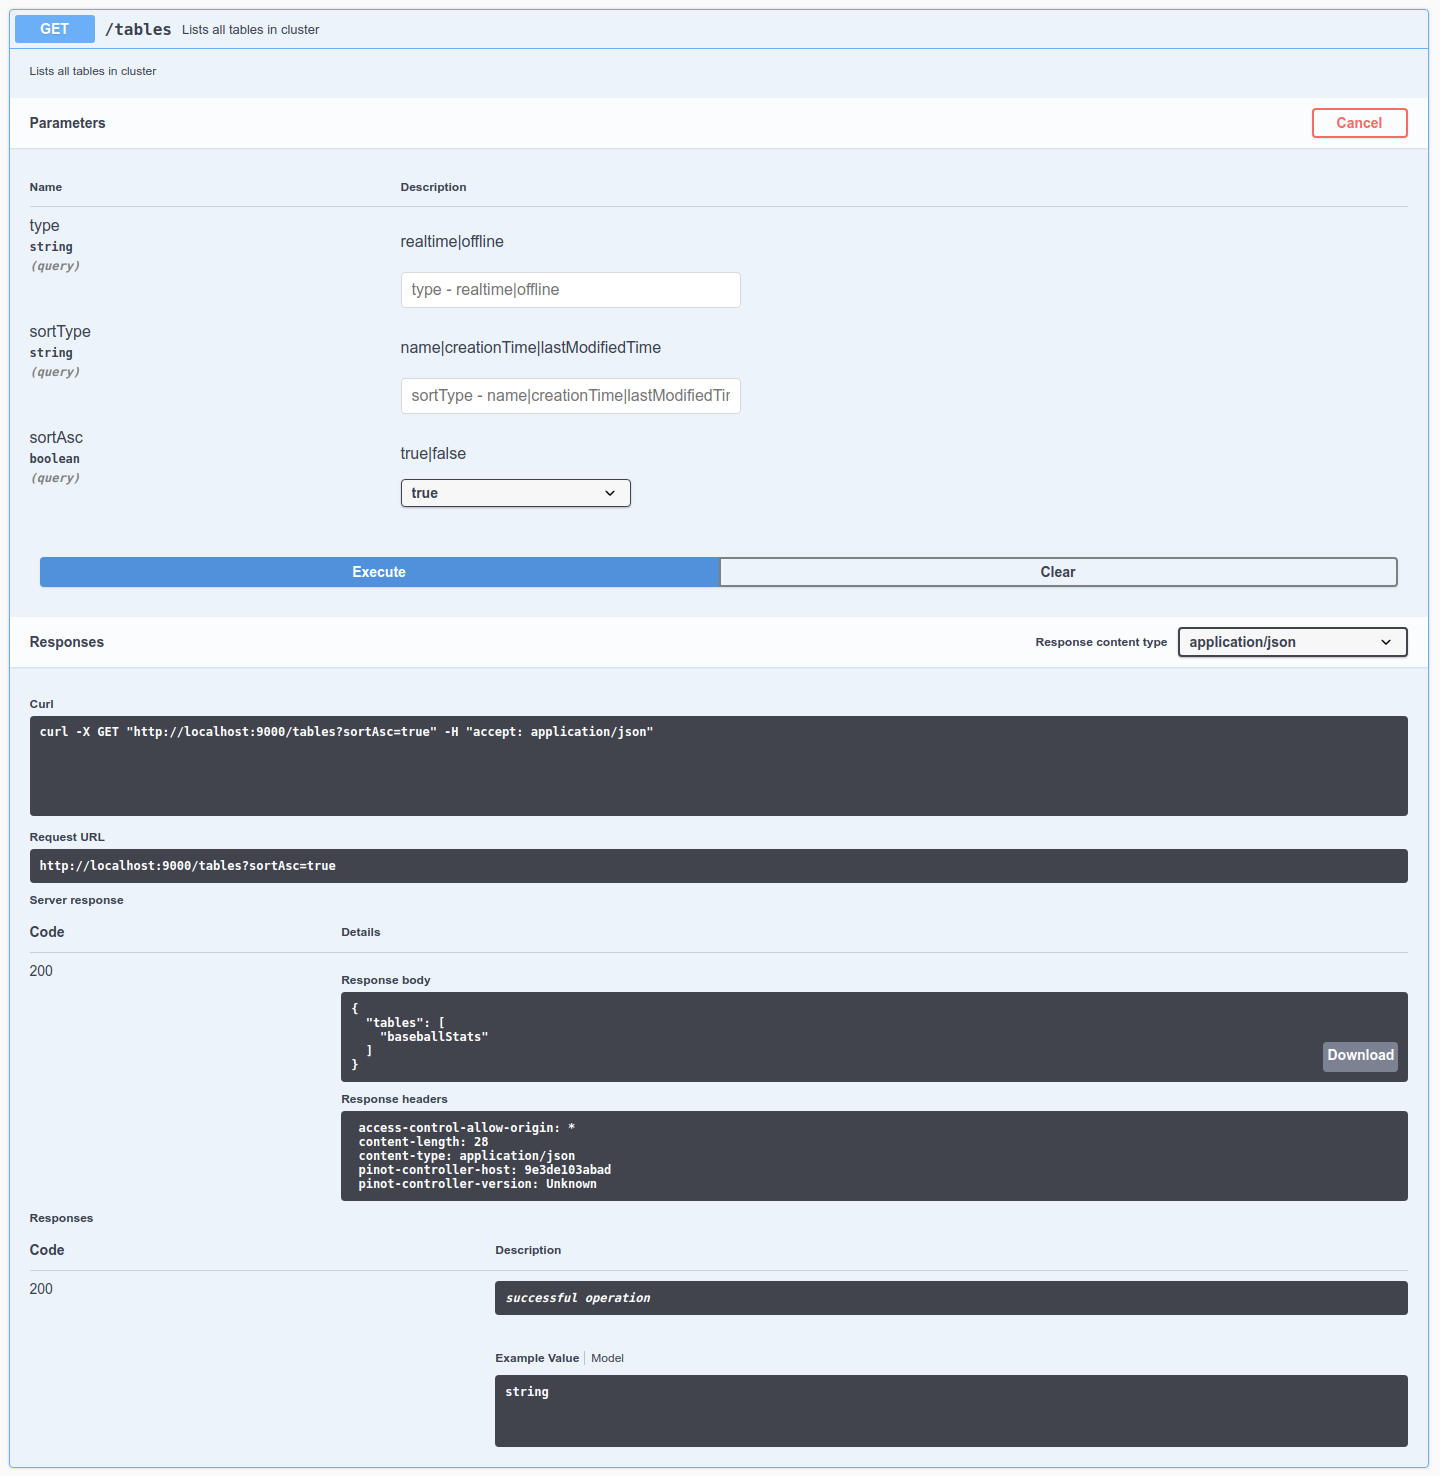
Let's check out the tables in this cluster by going to Table -> List all tables in cluster, click Try it out, and then click Execute. We can see thebaseballStats table listed here. We can also see the exact cURL call made to the controller API.
List all tables in cluster
You can look at the configuration of this table by going to Tables -> Get/Enable/Disable/Drop a table, click Try it out, type baseballStats in the table name, and then click Execute.
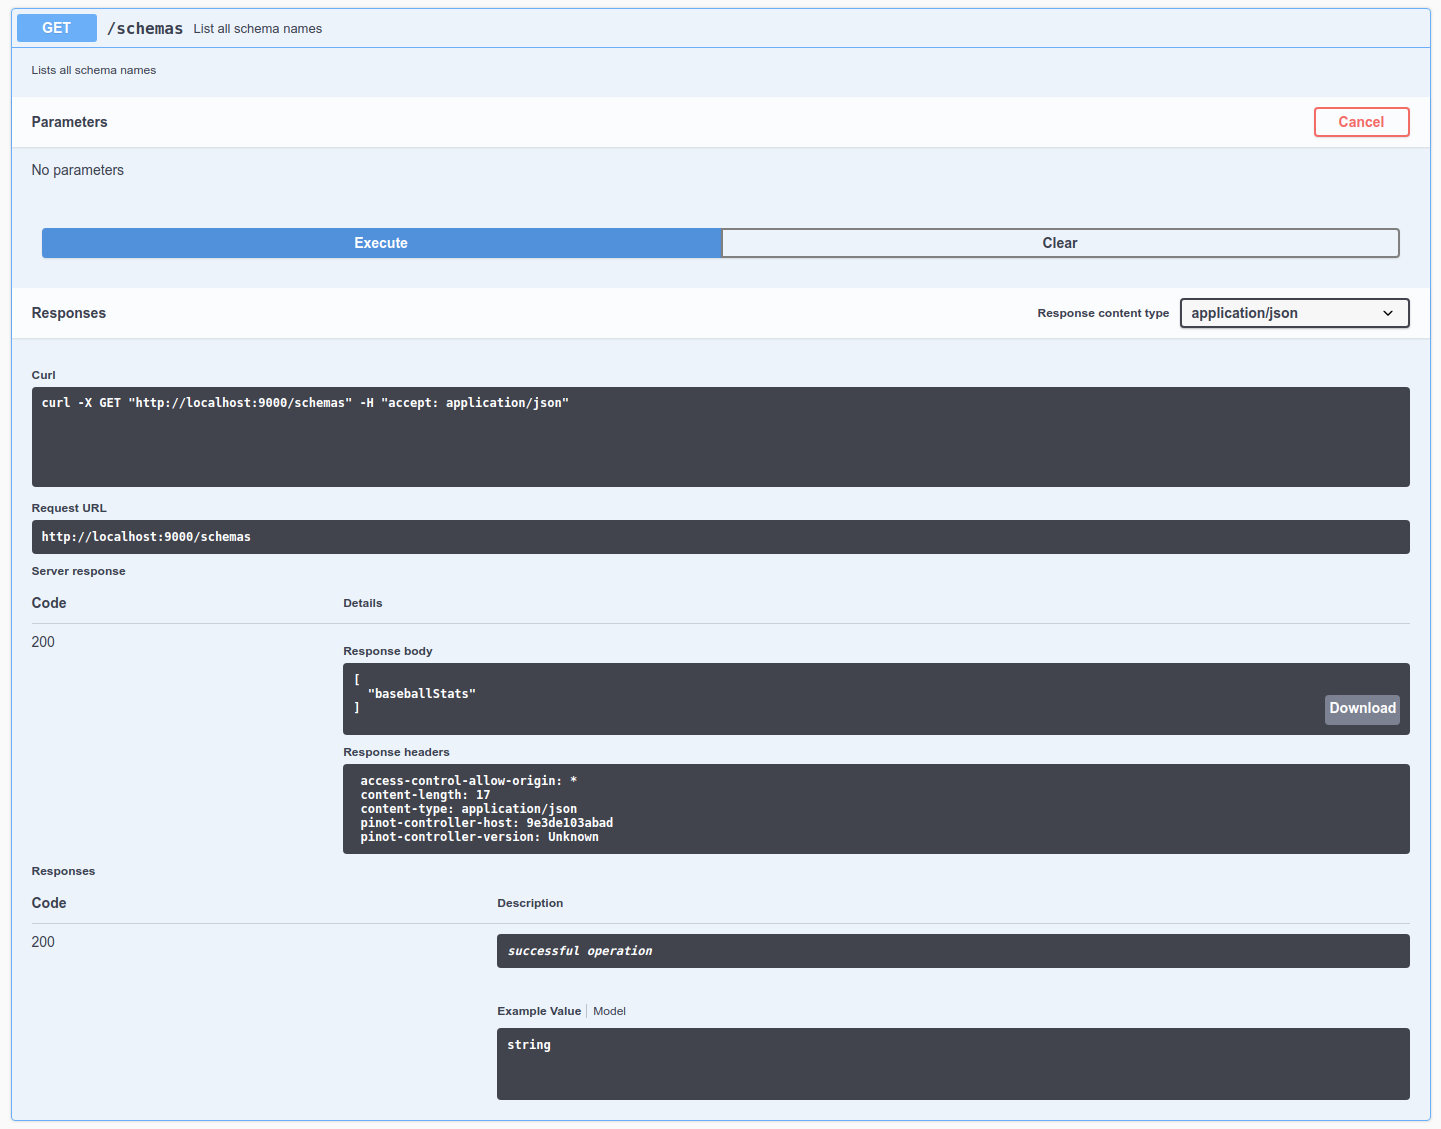
Let's check out the schemas in the cluster by going to Schema -> List all schemas in the cluster, click Try it out, and then click Execute. We can see a schema called baseballStats in this list.
List all schemas in the cluster
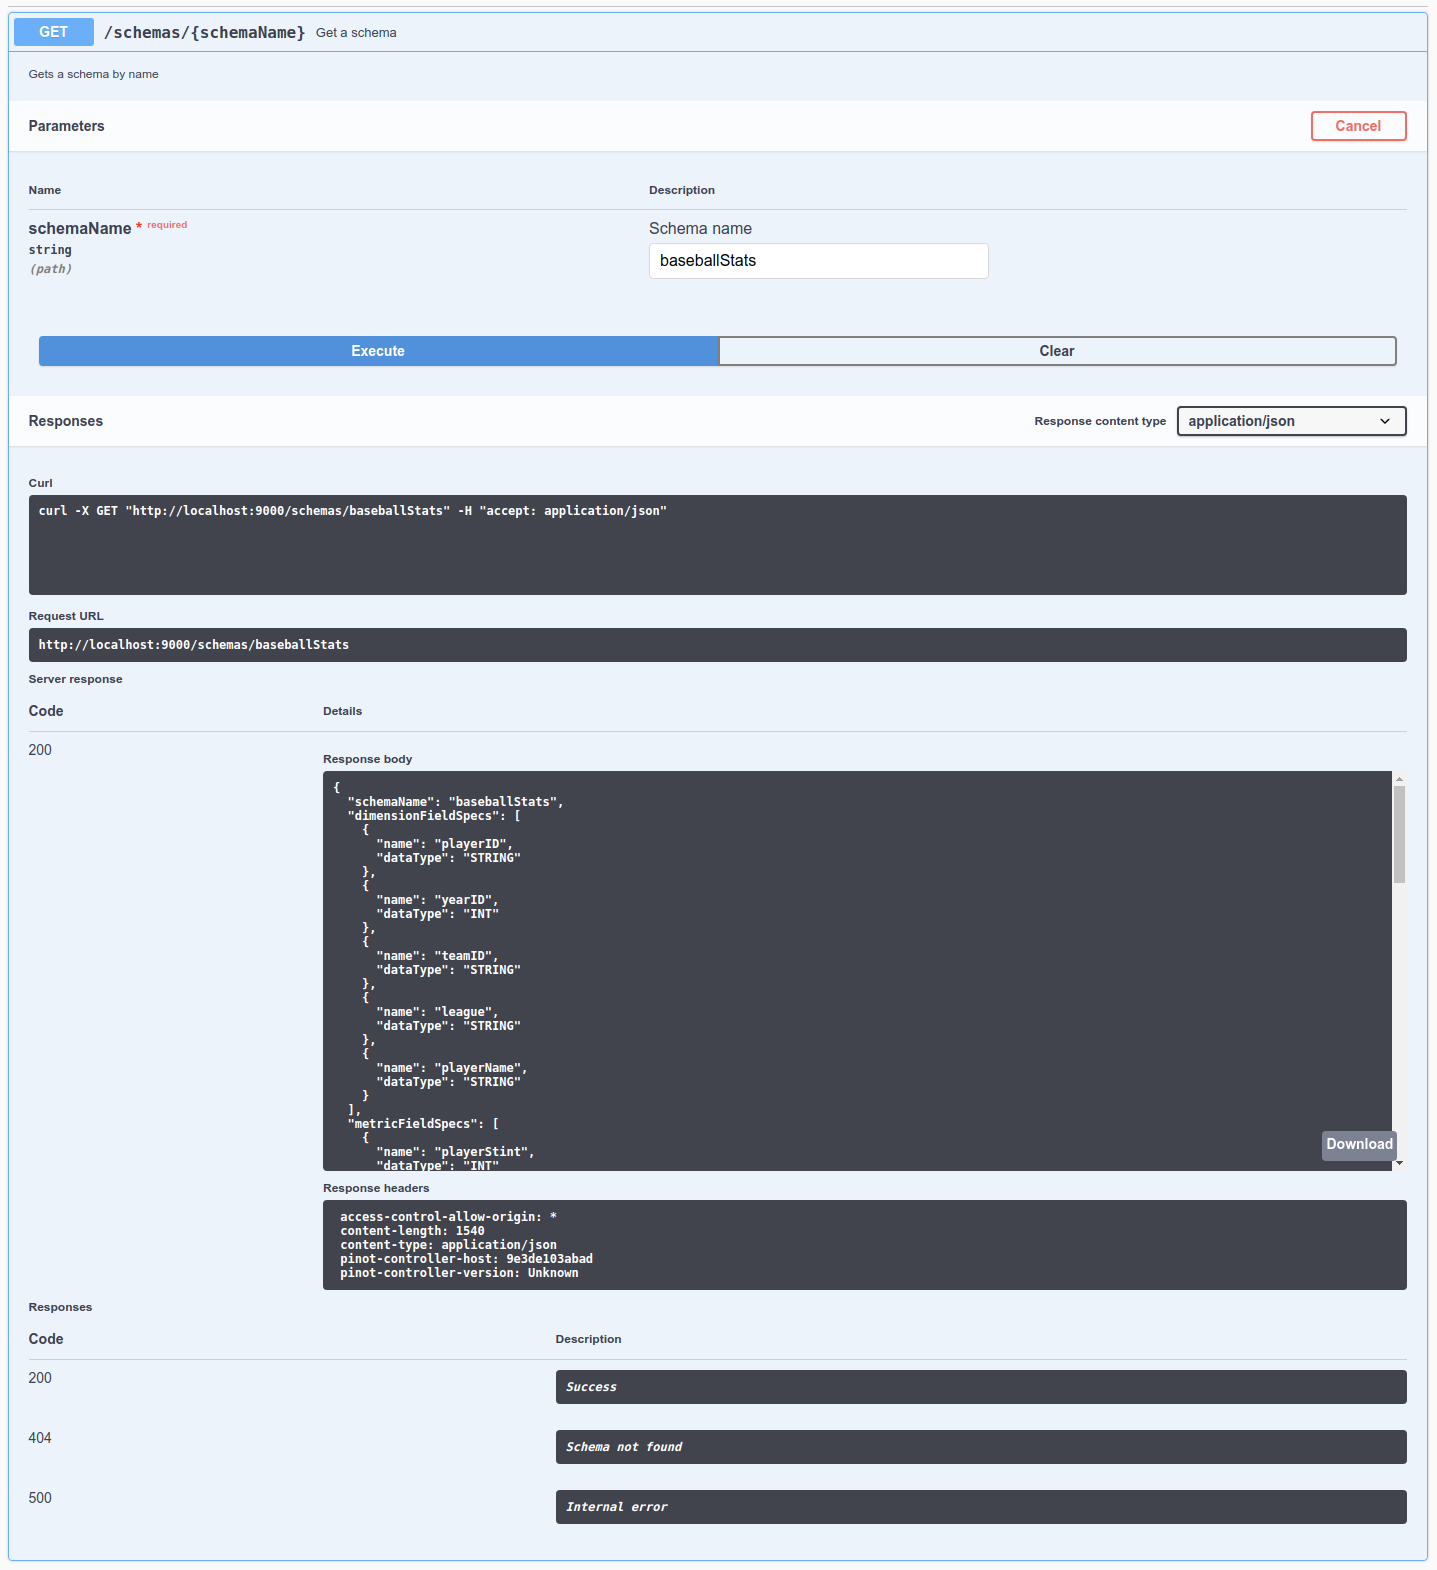
Take a look at the schema by going to Schema -> Get a schema, click Try it out, type baseballStats in the schema name, and then click Execute.
baseballStats Schema
Finally, let's check out the data segments in the cluster by going to Segment -> List all segments, click Try it out, type in baseballStats in the table name, and then click Execute. There's 1 segment for this table, called baseballStats_OFFLINE_0.
Explore the Schema component in Apache Pinot, vital for defining the structure and data types of Pinot tables, enabling efficient data processing and analysis.
Each table in Pinot is associated with a schema. A schema defines what fields are present in the table along with the data types.
The schema is stored in Zookeeper along with the table configuration.
Schema naming in Pinot follows typical database table naming conventions, such as starting names with a letter, not ending with an underscore, and using only alphanumeric characters
Categories
A schema also defines what category a column belongs to. Columns in a Pinot table can be categorized into three categories:
Category
Description
Pinot does not enforce strict rules on which of these categories columns belong to, rather the categories can be thought of as hints to Pinot to do internal optimizations.
For example, metrics may be stored without a dictionary and can have a different default null value.
The categories are also relevant when doing segment merge and rollups. Pinot uses the dimension and time fields to identify records against which to apply merge/rollups.
Metrics aggregation is another example where Pinot uses dimensions and time are used as the key, and automatically aggregates values for the metric columns.
For configuration details, see .
Date and time fields
Since Pinot doesn't have a dedicated DATETIME datatype support, you need to input time in either STRING, LONG, or INT format. However, Pinot needs to convert the date into an understandable format such as epoch timestamp to do operations. You can refer to for more details on supported formats.
Creating a schema
First, Make sure your and running.
Let's create a schema and put it in a JSON file. For this example, we have created a schema for flight data.
For more details on constructing a schema file, see the .
Then, we can upload the sample schema provided above using either a Bash command or REST API call.
Check out the schema in the to make sure it was successfully uploaded
Table
Explore the table component in Apache Pinot, a fundamental building block for organizing and managing data in Pinot clusters, enabling effective data processing and analysis.
A table is a logical abstraction that represents a collection of related data. It is composed of columns and rows (known as documents in Pinot). The columns, data types, and other metadata related to the table are defined using a .
Pinot breaks a table into multiple and stores these segments in a deep-store such as Hadoop Distributed File System (HDFS) as well as Pinot servers.
In the Pinot cluster, a table is modeled as a and each segment of a table is modeled as a .
select playerName, max(hits)
from baseballStats
group by playerName
order by max(hits) desc
select sum(hits), sum(homeRuns), sum(numberOfGames)
from baseballStats
where yearID > 2010
select *
from baseballStats
order by league
Usage: StartServer
	-serverHost               <String>                      : Host name for controller. (required=false)
	-serverPort               <int>                         : Port number to start the server at. (required=false)
	-serverAdminPort          <int>                         : Port number to serve the server admin API at. (required=false)
	-dataDir                  <string>                      : Path to directory containing data. (required=false)
	-segmentDir               <string>                      : Path to directory containing segments. (required=false)
	-zkAddress                <http>                        : Http address of Zookeeper. (required=false)
	-clusterName              <String>                      : Pinot cluster name. (required=false)
	-configFileName           <Config File Name>            : Broker Starter Config file. (required=false)
	-help                                                   : Print this message. (required=false)
Dimension columns are typically used in slice and dice operations for answering business queries. Some operations for which dimension columns are used:
GROUP BY - group by one or more dimension columns along with aggregations on one or more metric columns
Filter clauses such as WHERE
Metric
These columns represent the quantitative data of the table. Such columns are used for aggregation. In data warehouse terminology, these can also be referred to as fact or measure columns.
Some operation for which metric columns are used:
Aggregation - SUM, MIN, MAX, COUNT, AVG etc
Filter clause such as WHERE
DateTime
This column represents time columns in the data. There can be multiple time columns in a table, but only one of them can be treated as primary. The primary time column is the one that is present in the segment config.
The primary time column is used by Pinot to maintain the time boundary between offline and real-time data in a hybrid table and for retention management. A primary time column is mandatory if the table's push type is APPEND and optional if the push type is REFRESH .
Common operations that can be done on time column:
Table naming in Pinot follows typical naming conventions, such as starting names with a letter, not ending with an underscore, and using only alphanumeric characters.
Pinot supports the following types of tables:
Type
Description
Offline
Offline tables ingest pre-built Pinot segments from external data stores and are generally used for batch ingestion.
Real-time
Real-time tables ingest data from streams (such as Kafka) and build segments from the consumed data.
Hybrid
Hybrid Pinot tables have both real-time as well as offline tables under the hood. By default, all tables in Pinot are hybrid.
The user querying the database does not need to know the type of the table. They only need to specify the table name in the query.
e.g. regardless of whether we have an offline table myTable_OFFLINE, a real-time table myTable_REALTIME, or a hybrid table containing both of these, the query will be:
Table configuration is used to define the table properties, such as name, type, indexing, routing, and retention. It is written in JSON format and is stored in Zookeeper, along with the table schema.
Use the following properties to make your tables faster or leaner:
Segment
Indexing
Tenants
Segments
A table is comprised of small chunks of data known as segments. Learn more about how Pinot creates and manages segments here.
For offline tables, segments are built outside of Pinot and uploaded using a distributed executor such as Spark or Hadoop. For details, see Batch Ingestion.
For real-time tables, segments are built in a specific interval inside Pinot. You can tune the following for the real-time segments.
Flush
The Pinot real-time consumer ingests the data, creates the segment, and then flushes the in-memory segment to disk. Pinot allows you to configure when to flush the segment in the following ways:
Number of consumed rows: After consuming the specified number of rows from the stream, Pinot will persist the segment to disk.
Number of desired rows per segment: Pinot learns and then estimates the number of rows that need to be consumed. The learning phase starts by setting the number of rows to 100,000 (this value can be changed) and adjusts it to reach the appropriate segment size. Because Pinot corrects the estimate as it goes along, the segment size might go significantly over the correct size during the learning phase. You should set this value to optimize the performance of queries.
Max time duration to wait: Pinot consumers wait for the configured time duration after which segments are persisted to the disk.
Replicas
A segment can have multiple replicas to provide higher availability. You can configure the number of replicas for a table segment using the CLI.
Completion Mode
By default, if the in-memory segment in the non-winner server is equivalent to the committed segment, then the non-winner server builds and replaces the segment. If the available segment is not equivalent to the committed segment, the server just downloads the committed segment from the controller.
However, in certain scenarios, the segment build can get very memory-intensive. In these cases, you might want to enforce the non-committer servers to just download the segment from the controller instead of building it again. You can do this by setting completionMode: "DOWNLOAD" in the table configuration.
A Pinot server might fail to download segments from the deep store, such as HDFS, after its completion. However, you can configure servers to download these segments from peer servers instead of the deep store. Currently, only HTTP and HTTPS download schemes are supported. More methods, such as gRPC/Thrift, are planned be added in the future.
Dictionary-encoded forward index with bit compression
Raw value forward index
Sorted forward index with run-length encoding
Bitmap inverted index
Sorted inverted index
For more details on each indexing mechanism and corresponding configurations, see Indexing.
Set up Bloomfilters on columns to make queries faster. You can also keep segments in off-heap instead of on-heap memory for faster queries.
Pre-aggregation
Aggregate the real-time stream data as it is consumed to reduce segment sizes. We add the metric column values of all rows that have the same values for all dimension and time columns and create a single row in the segment. This feature is only available on REALTIME tables.
The only supported aggregation is SUM. The columns to pre-aggregate need to satisfy the following requirements:
All metrics should be listed in noDictionaryColumns.
No multi-value dimensions
All dimension columns are treated to have a dictionary, even if they appear as noDictionaryColumns in the config.
The following table config snippet shows an example of enabling pre-aggregation during real-time ingestion:
Tenants
Each table is associated with a tenant. A segment resides on the server, which has the same tenant as itself. For details, see Tenant.
Optionally, override if a table should move to a server with different tenant based on segment status. The example below adds a tagOverrideConfig under the tenants section for real-time tables to override tags for consuming and completed segments.
In the above example, the consuming segments will still be assigned to serverTenantName_REALTIME hosts, but once they are completed, the segments will be moved to serverTeantnName_OFFLINE.
You can specify the full name of any tag in this section. For example, you could decide that completed segments for this table should be in Pinot servers tagged as allTables_COMPLETED). To learn more about, see the Moving Completed Segments section.
Hybrid table
A hybrid table is a table composed of two tables, one offline and one real-time, that share the same name. In a hybrid table, offline segments can be pushed periodically. The retention on the offline table can be set to a high value because segments are coming in on a periodic basis, whereas the retention on the real-time part can be small.
Once an offline segment is pushed to cover a recent time period, the brokers automatically switch to using the offline table for segments for that time period and use the real-time table only for data not available in the offline table.
To learn how time boundaries work for hybrid tables, see Broker.
A typical use case for hybrid tables is pushing deduplicated, cleaned-up data into an offline table every day while consuming real-time data as it arrives. Data can remain in offline tables for as long as a few years, while the real-time data would be cleaned every few days.
Examples
Create a table config for your data, or see examples for all possible batch/streaming tables.
Discover the segment component in Apache Pinot for efficient data storage and querying within Pinot clusters, enabling optimized data processing and analysis.
Pinot has the concept of a table, which is a logical abstraction to refer to a collection of related data. Pinot has a distributed architecture and scales horizontally. Pinot expects the size of a table to grow infinitely over time. In order to achieve this, the entire data needs to be distributed across multiple nodes.
Pinot achieves this by breaking the data into smaller chunks known as segments (similar to shards/partitions in relational databases). Segments can be seen as time-based partitions.
A segment is a horizontal shard representing a chunk of table data with some number of rows. The segment stores data for all columns of the table. Each segment packs the data in a columnar fashion, along with the dictionaries and indices for the columns. The segment is laid out in a columnar format so that it can be directly mapped into memory for serving queries.
Columns can be single or multi-valued and the following types are supported: STRING, BOOLEAN, INT, LONG, FLOAT, DOUBLE, TIMESTAMP or BYTES. Only single-valued BIG_DECIMAL data type is supported.
Columns may be declared to be metric or dimension (or specifically as a time dimension) in the schema. Columns can have default null values. For example, the default null value of a integer column can be 0. The default value for bytes columns must be hex-encoded before it's added to the schema.
Pinot uses dictionary encoding to store values as a dictionary ID. Columns may be configured to be “no-dictionary” column in which case raw values are stored. Dictionary IDs are encoded using minimum number of bits for efficient storage (e.g. a column with a cardinality of 3 will use only 2 bits for each dictionary ID).
A forward index is built for each column and compressed for efficient memory use. In addition, you can optionally configure inverted indices for any set of columns. Inverted indices take up more storage, but improve query performance. Specialized indexes like Star-Tree index are also supported. For more details, see .
Creating a segment
Once the table is configured, we can load some data. Loading data involves generating pinot segments from raw data and pushing them to the pinot cluster. Data can be loaded in batch mode or streaming mode. For more details, see the page.
Load data in batch
Prerequisites
Below are instructions to generate and push segments to Pinot via standalone scripts. For a production setup, you should use frameworks such as Hadoop or Spark. For more details on setting up data ingestion jobs, see
Job Spec YAML
To generate a segment, we need to first create a job spec YAML file. This file contains all the information regarding data format, input data location, and pinot cluster coordinates. Note that this assumes that the controller is RUNNING to fetch the table config and schema. If not, you will have to configure the spec to point at their location. For full configurations, see .
Create and push segment
To create and push the segment in one go, use the following:
Sample Console Output
Alternately, you can separately create and then push, by changing the jobType to SegmentCreation or SegmenTarPush.
Templating Ingestion Job Spec
The Ingestion job spec supports templating with Groovy Syntax.
This is convenient if you want to generate one ingestion job template file and schedule it on a daily basis with extra parameters updated daily.
e.g. you could set inputDirURI with parameters to indicate the date, so that the ingestion job only processes the data for a particular date. Below is an example that templates the date for input and output directories.
You can pass in arguments containing values for ${year}, ${month}, ${day} when kicking off the ingestion job: -values $param=value1 $param2=value2...
This ingestion job only generates segments for date 2014-01-03
Load data in streaming
Prerequisites
Below is an example of how to publish sample data to your stream. As soon as data is available to the real-time stream, it starts getting consumed by the real-time servers.
Kafka
Run below command to stream JSON data into Kafka topic: flights-realtime
Run below command to stream JSON data into Kafka topic: flights-realtime
Explore the minion component in Apache Pinot, empowering efficient data movement and segment generation within Pinot clusters.
A minion is a standby component that leverages the Helix Task Framework to offload computationally intensive tasks from other components.
It can be attached to an existing Pinot cluster and then execute tasks as provided by the controller. Custom tasks can be plugged via annotations into the cluster. Some typical minion tasks are:
Segment creation
Segment purge
Segment merge
Starting a Minion
Make sure you've . If you're using Docker, make sure to . To start a minion:
Interfaces
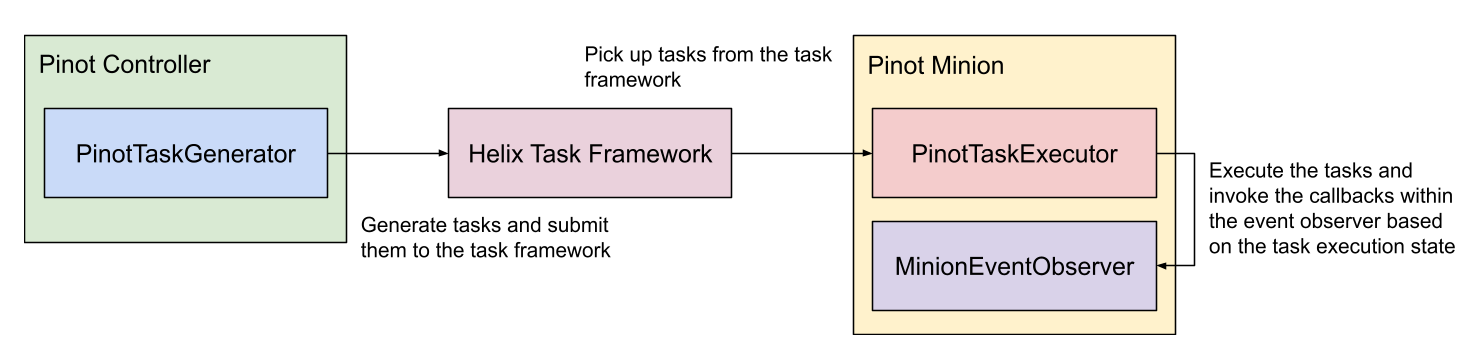
PinotTaskGenerator
PinotTaskGenerator interface defines the APIs for the controller to generate tasks for minions to execute.
PinotTaskExecutorFactory
Factory for PinotTaskExecutor which defines the APIs for Minion to execute the tasks.
MinionEventObserverFactory
Factory for MinionEventObserver which defines the APIs for task event callbacks on minion.
Built-in tasks
SegmentGenerationAndPushTask
The PushTask can fetch files from an input folder e.g. from a S3 bucket and converts them into segments. The PushTask converts one file into one segment and keeps file name in segment metadata to avoid duplicate ingestion. Below is an example task config to put in TableConfig to enable this task. The task is scheduled every 10min to keep ingesting remaining files, with 10 parallel task at max and 1 file per task.
NOTE: You may want to simply omit "tableMaxNumTasks" due to this caveat: the task generates one segment per file, and derives segment name based on the time column of the file. If two files happen to have same time range and are ingested by tasks from different schedules, there might be segment name conflict. To overcome this issue for now, you can omit “tableMaxNumTasks” and by default it’s Integer.MAX_VALUE, meaning to schedule as many tasks as possible to ingest all input files in a single batch. Within one batch, a sequence number suffix is used to ensure no segment name conflict. Because the sequence number suffix is scoped within one batch, tasks from different batches might encounter segment name conflict issue said above.
When performing ingestion at scale remember that Pinot will list all of the files contained in the `inputDirURI` every time a `SegmentGenerationAndPushTask` job gets scheduled. This could become a bottleneck when fetching files from a cloud bucket like GCS. To prevent this make `inputDirURI` point to the least number of files possible.
RealtimeToOfflineSegmentsTask
See for details.
MergeRollupTask
See for details.
Enable tasks
Tasks are enabled on a per-table basis. To enable a certain task type (e.g. myTask) on a table, update the table config to include the task type:
Under each enable task type, custom properties can be configured for the task type.
There are also two task configs to be set as part of cluster configs like below. One controls task's overall timeout (1hr by default) and one for how many tasks to run on a single minion worker (1 by default).
Schedule tasks
Auto-schedule
There are 2 ways to enable task scheduling:
Controller level schedule for all minion tasks
Tasks can be scheduled periodically for all task types on all enabled tables. Enable auto task scheduling by configuring the schedule frequency in the controller config with the key controller.task.frequencyPeriod. This takes period strings as values, e.g. 2h, 30m, 1d.
Per table and task level schedule
Tasks can also be scheduled based on cron expressions. The cron expression is set in the schedule config for each task type separately. This config in the controller config, controller.task.scheduler.enabled should be set to true to enable cron scheduling.
As shown below, the RealtimeToOfflineSegmentsTask will be scheduled at the first second of every minute (following the syntax ).
Manual schedule
Tasks can be manually scheduled using the following controller rest APIs:
Rest API
Description
Plug-in custom tasks
To plug in a custom task, implement PinotTaskGenerator, PinotTaskExecutorFactory and MinionEventObserverFactory (optional) for the task type (all of them should return the same string for getTaskType()), and annotate them with the following annotations:
Implementation
Annotation
After annotating the classes, put them under the package of name org.apache.pinot.*.plugin.minion.tasks.*, then they will be auto-registered by the controller and minion.
Example
See where the TestTask is plugged-in.
Task Manager UI
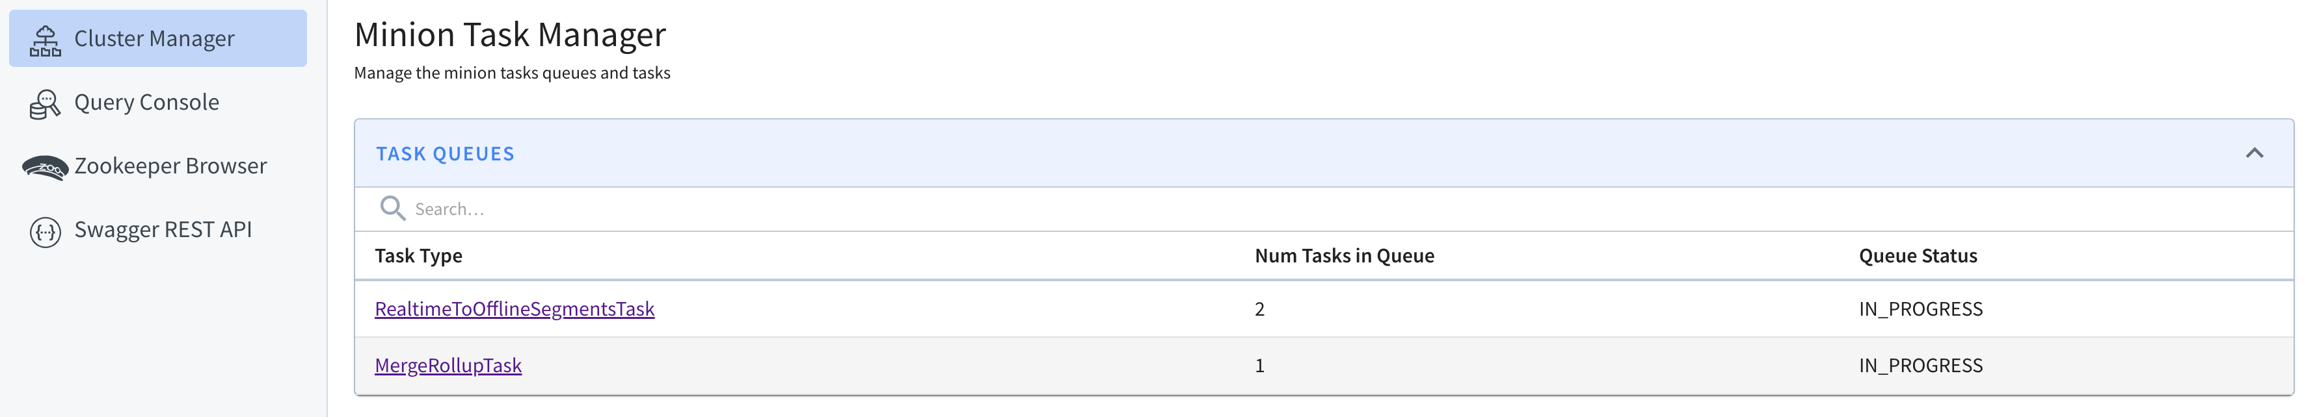
In the Pinot UI, there is Minion Task Manager tab under Cluster Manager page. From that minion task manager tab, one can find a lot of task related info for troubleshooting. Those info are mainly collected from the Pinot controller that schedules tasks or Helix that tracks task runtime status. There are also buttons to schedule tasks in an ad hoc way. Below are some brief introductions to some pages under the minion task manager tab.
This one shows which types of Minion Task have been used. Essentially which task types have created their task queues in Helix.
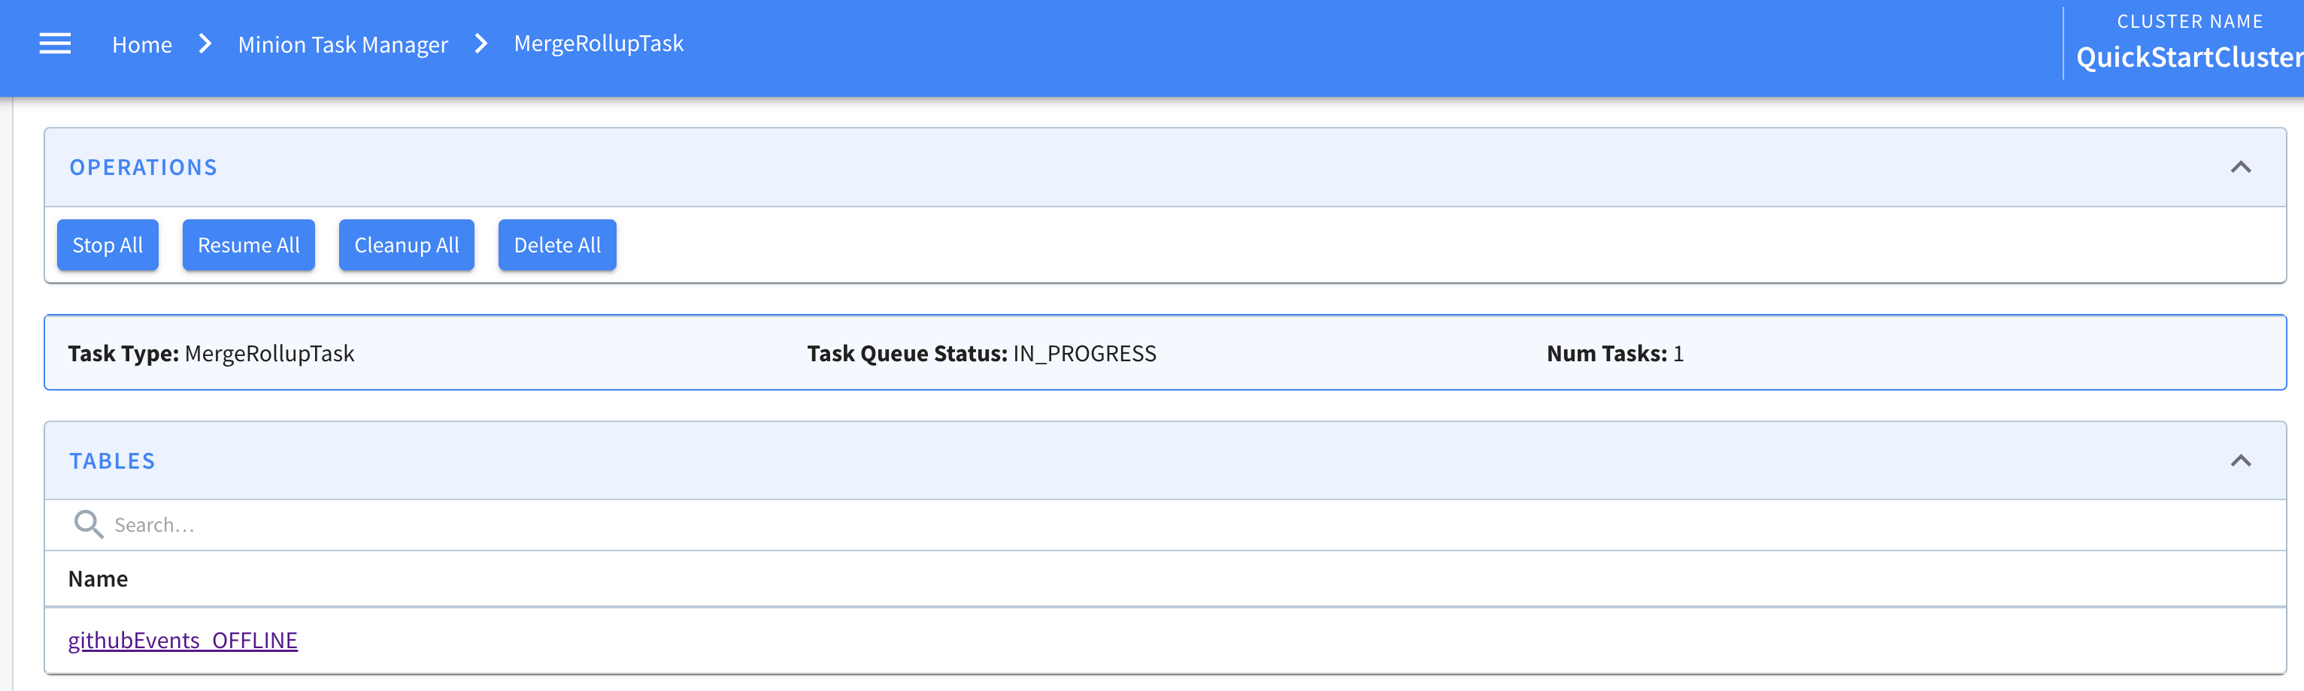
Clicking into a task type, one can see the tables using that task. And a few buttons to stop the task queue, cleaning up ended tasks etc.
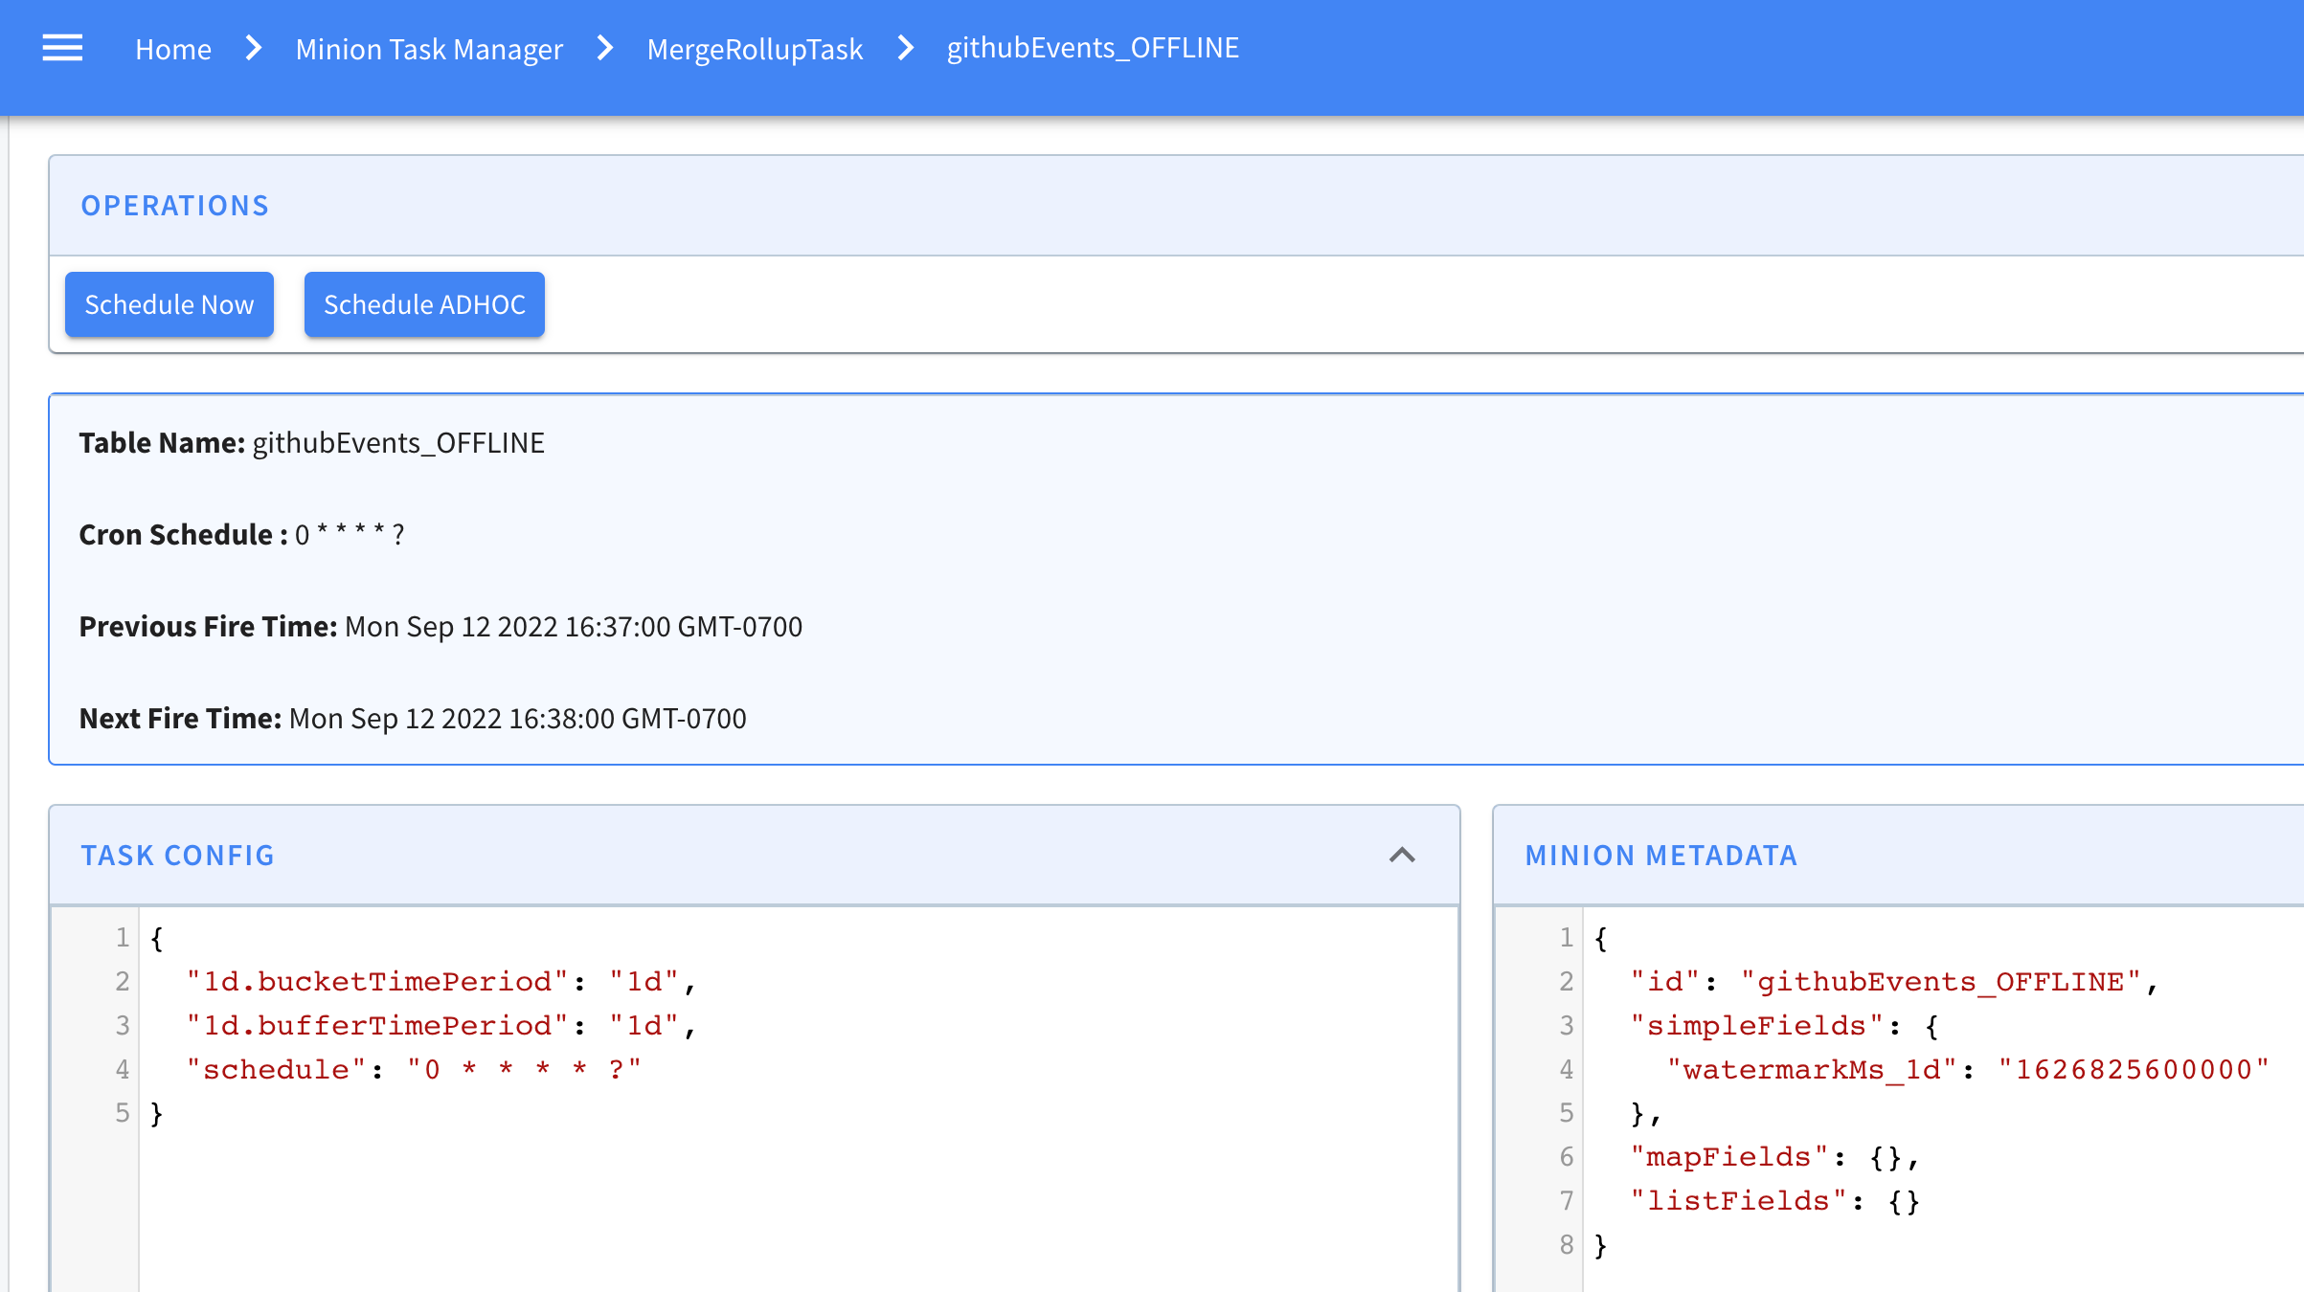
Then clicking into any table in this list, one can see how the task is configured for that table. And the task metadata if there is one in ZK. For example, MergeRollupTask tracks a watermark in ZK. If the task is cron scheduled, the current and next schedules are also shown in this page like below.
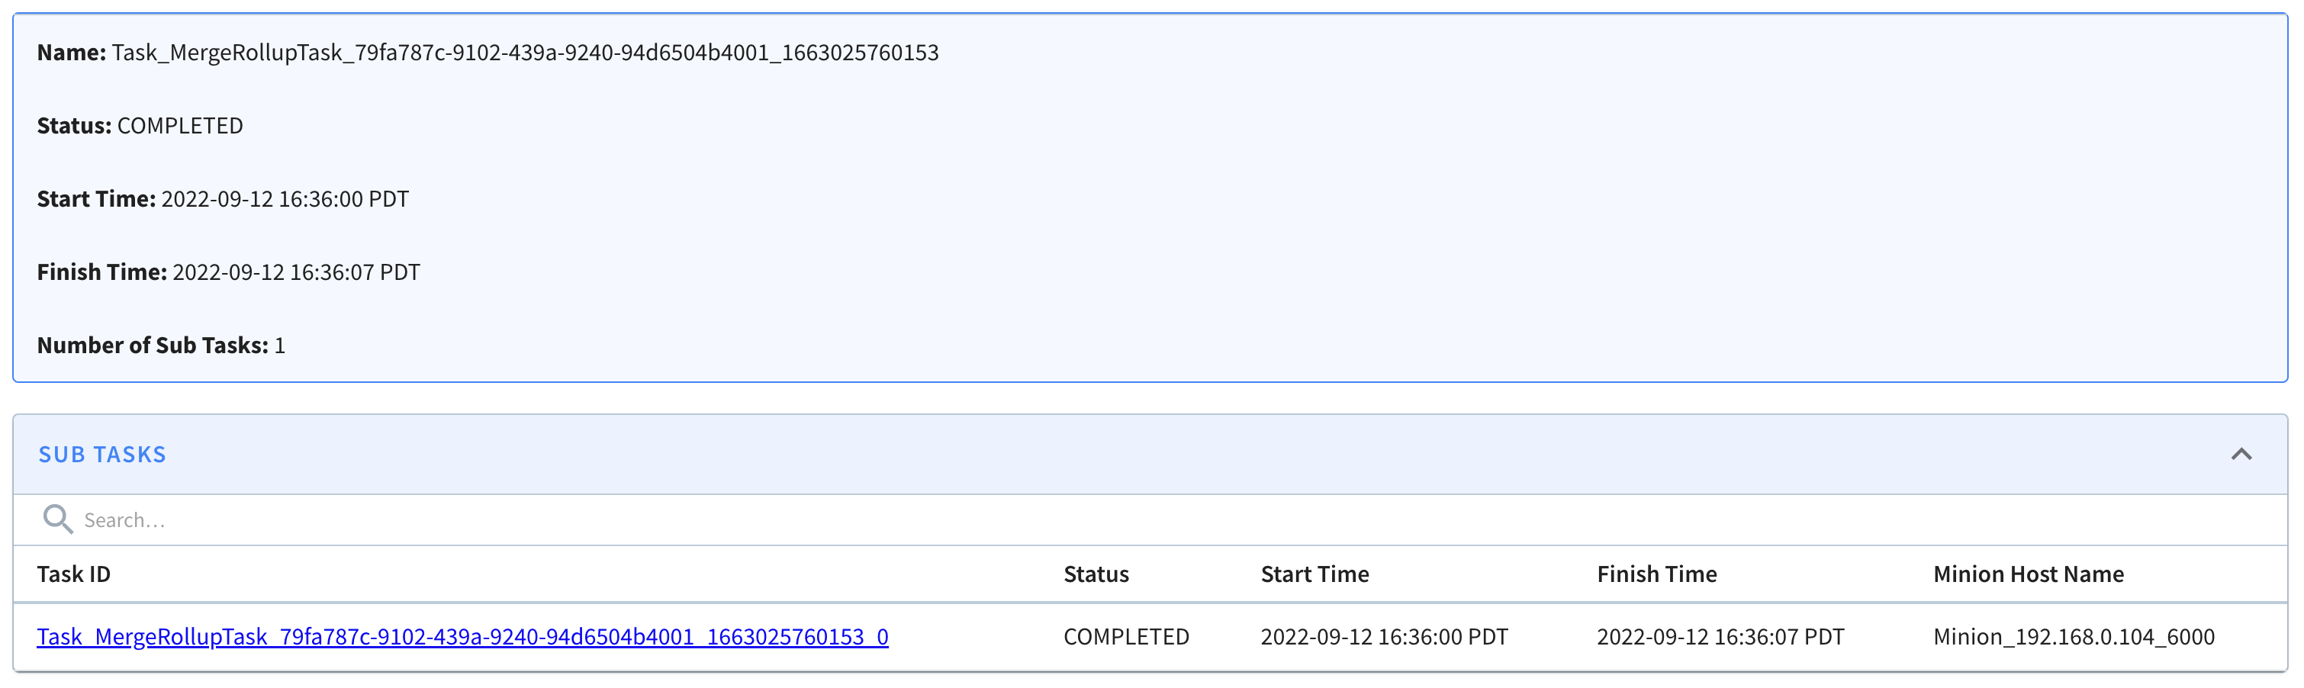
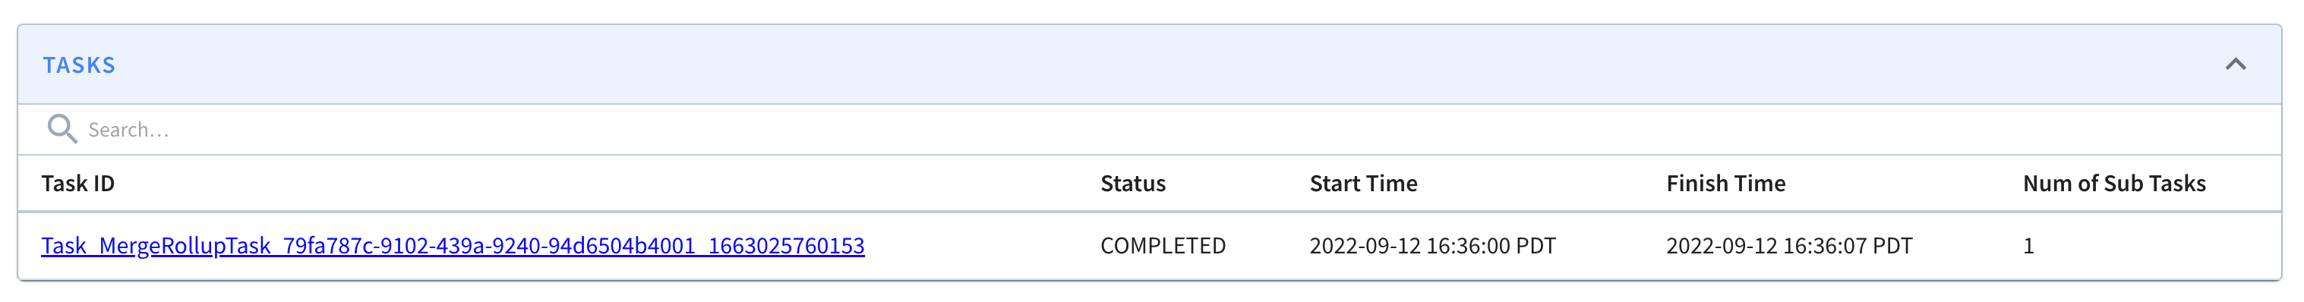
At the bottom of this page is a list of tasks generated for this table for this specific task type. Like here, one MergeRollup task has been generated and completed.
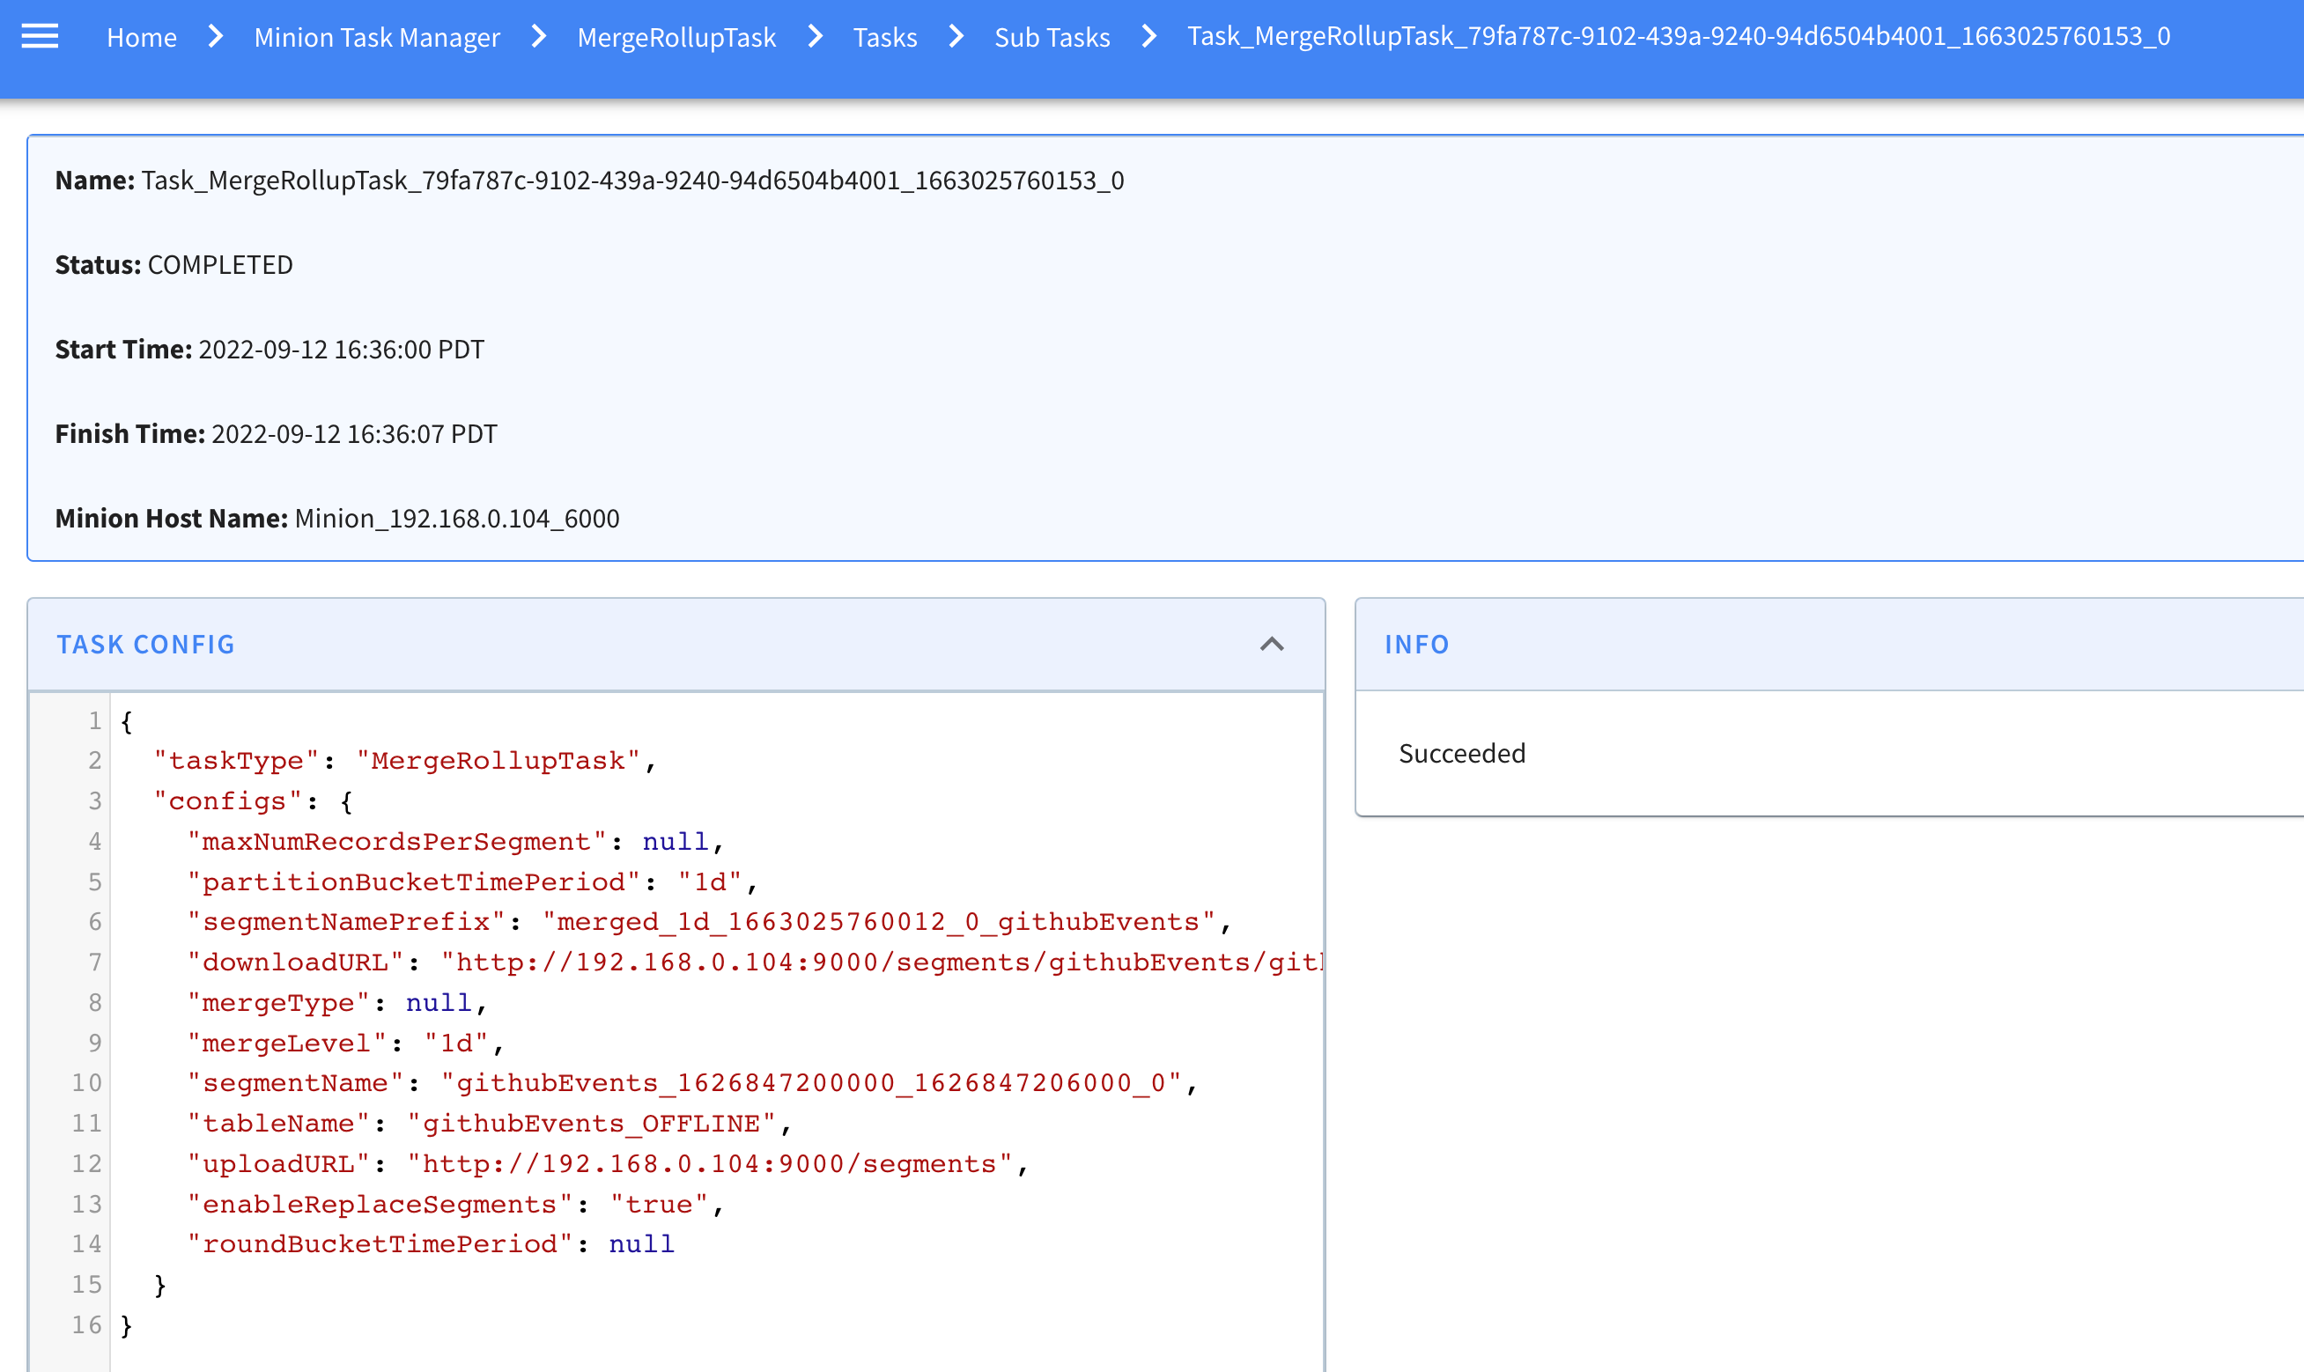
Clicking into a task from that list, we can see start/end time for it, and the sub tasks generated for that task (as context, one minion task can have multiple sub-tasks to process data in parallel). In this example, it happened to have one sub-task here, and it shows when it starts and stops and which minion worker it's running.
Clicking into this subtask, one can see more details about it like the input task configs and error info if the task failed.
Task-related metrics
There is a controller job that runs every 5 minutes by default and emits metrics about Minion tasks scheduled in Pinot. The following metrics are emitted for each task type:
NumMinionTasksInProgress: Number of running tasks
NumMinionSubtasksRunning: Number of running sub-tasks
NumMinionSubtasksWaiting: Number of waiting sub-tasks (unassigned to a minion as yet)
The controller also emits metrics about how tasks are cron scheduled:
cronSchedulerJobScheduled: Number of current cron schedules registered to be triggered regularly according their cron expressions. It's a Gauge.
cronSchedulerJobTrigger: Number of cron scheduled triggered, as a Meter.
cronSchedulerJobSkipped: Number of late cron scheduled skipped, as a Meter.
For each task, the minion will emit these metrics:
TASK_QUEUEING: Task queueing time (task_dequeue_time - task_inqueue_time), assuming the time drift between helix controller and pinot minion is minor, otherwise the value may be negative
TASK_EXECUTION: Task execution time, which is the time spent on executing the task
NUMBER_OF_TASKS: number of tasks in progress on that minion. Whenever a Minion starts a task, increase the Gauge by 1, whenever a Minion completes (either succeeded or failed) a task, decrease it by 1
NumMinionSubtasksError: Number of error sub-tasks (completed with an error/exception)
PercentMinionSubtasksInQueue: Percent of sub-tasks in waiting or running states
PercentMinionSubtasksInError: Percent of sub-tasks in error
cronSchedulerJobExecutionTimeMs: Time used to complete task generation, as a Timer.
NUMBER_TASKS_EXECUTED: Number of tasks executed, as a Meter.
NUMBER_TASKS_COMPLETED: Number of tasks completed, as a Meter.
NUMBER_TASKS_CANCELLED: Number of tasks cancelled, as a Meter.
NUMBER_TASKS_FAILED: Number of tasks failed, as a Meter. Different from fatal failure, the task encountered an error which can not be recovered from this run, but it may still succeed by retrying the task.
NUMBER_TASKS_FATAL_FAILED: Number of tasks fatal failed, as a Meter. Different from failure, the task encountered an error, which will not be recoverable even with retrying the task.
POST /tasks/schedule
Schedule tasks for all task types on all enabled tables
POST /tasks/schedule?taskType=myTask
Schedule tasks for the given task type on all enabled tables
POST /tasks/schedule?tableName=myTable_OFFLINE
Schedule tasks for all task types on the given table
POST /tasks/schedule?taskType=myTask&tableName=myTable_OFFLINE
Schedule tasks for the given task type on the given table
Usage: StartMinion
    -help                                                   : Print this message. (required=false)
    -minionHost               <String>                      : Host name for minion. (required=false)
    -minionPort               <int>                         : Port number to start the minion at. (required=false)
    -zkAddress                <http>                        : HTTP address of Zookeeper. (required=false)
    -clusterName              <String>                      : Pinot cluster name. (required=false)
    -configFileName           <Config File Name>            : Minion Starter Config file. (required=false)
public interface PinotTaskGenerator {

  /**
   * Initializes the task generator.
   */
  void init(ClusterInfoAccessor clusterInfoAccessor);

  /**
   * Returns the task type of the generator.
   */
  String getTaskType();

  /**
   * Generates a list of tasks to schedule based on the given table configs.
   */
  List<PinotTaskConfig> generateTasks(List<TableConfig> tableConfigs);

  /**
   * Returns the timeout in milliseconds for each task, 3600000 (1 hour) by default.
   */
  default long getTaskTimeoutMs() {
    return JobConfig.DEFAULT_TIMEOUT_PER_TASK;
  }

  /**
   * Returns the maximum number of concurrent tasks allowed per instance, 1 by default.
   */
  default int getNumConcurrentTasksPerInstance() {
    return JobConfig.DEFAULT_NUM_CONCURRENT_TASKS_PER_INSTANCE;
  }

  /**
   * Performs necessary cleanups (e.g. remove metrics) when the controller leadership changes.
   */
  default void nonLeaderCleanUp() {
  }
}
public interface PinotTaskExecutorFactory {

  /**
   * Initializes the task executor factory.
   */
  void init(MinionTaskZkMetadataManager zkMetadataManager);

  /**
   * Returns the task type of the executor.
   */
  String getTaskType();

  /**
   * Creates a new task executor.
   */
  PinotTaskExecutor create();
}
public interface PinotTaskExecutor {

  /**
   * Executes the task based on the given task config and returns the execution result.
   */
  Object executeTask(PinotTaskConfig pinotTaskConfig)
      throws Exception;

  /**
   * Tries to cancel the task.
   */
  void cancel();
}
public interface MinionEventObserverFactory {

  /**
   * Initializes the task executor factory.
   */
  void init(MinionTaskZkMetadataManager zkMetadataManager);

  /**
   * Returns the task type of the event observer.
   */
  String getTaskType();

  /**
   * Creates a new task event observer.
   */
  MinionEventObserver create();
}
public interface MinionEventObserver {

  /**
   * Invoked when a minion task starts.
   *
   * @param pinotTaskConfig Pinot task config
   */
  void notifyTaskStart(PinotTaskConfig pinotTaskConfig);

  /**
   * Invoked when a minion task succeeds.
   *
   * @param pinotTaskConfig Pinot task config
   * @param executionResult Execution result
   */
  void notifyTaskSuccess(PinotTaskConfig pinotTaskConfig, @Nullable Object executionResult);

  /**
   * Invoked when a minion task gets cancelled.
   *
   * @param pinotTaskConfig Pinot task config
   */
  void notifyTaskCancelled(PinotTaskConfig pinotTaskConfig);

  /**
   * Invoked when a minion task encounters exception.
   *
   * @param pinotTaskConfig Pinot task config
   * @param exception Exception encountered during execution
   */
  void notifyTaskError(PinotTaskConfig pinotTaskConfig, Exception exception);
}
Using "POST /cluster/configs" API on CLUSTER tab in Swagger, with this payload
{
	"RealtimeToOfflineSegmentsTask.timeoutMs": "600000",
	"RealtimeToOfflineSegmentsTask.numConcurrentTasksPerInstance": "4"
}