Running Pinot in Production
You will need the following in order to run pinot in production:
Hardware for controller/broker/servers as per your load
Working installation of Zookeeper that Pinot can use. We recommend setting aside a path within zookpeer and including that path in pinot.controller.zkStr. Pinot will create its own cluster under this path (cluster name decided by pinot.controller.helixClusterName)
Shared storage mounted on controllers (if you plan to have multiple controllers for the same cluster). Alternatively, an implementation of PinotFS that the Pinot hosts have access to.
HTTP load balancers for spraying queries across brokers (or other mechanism to balance queries)
HTTP load balancers for spraying controller requests (e.g. segment push, or other controller APIs) or other mechanisms for distribution of these requests.
Deploying Pinot
In general, when deploying Pinot services, it is best to adhere to a specific ordering in which the various components should be deployed. This deployment order is recommended in case of the scenario that there might be protocol or other significant differences, the deployments go out in a predictable order in which failure due to these changes can be avoided.
The ordering is as follows:
Pinot provides a web-based management console and a command-line utility (pinot-admin.sh) in order to help provision and manage pinot clusters.
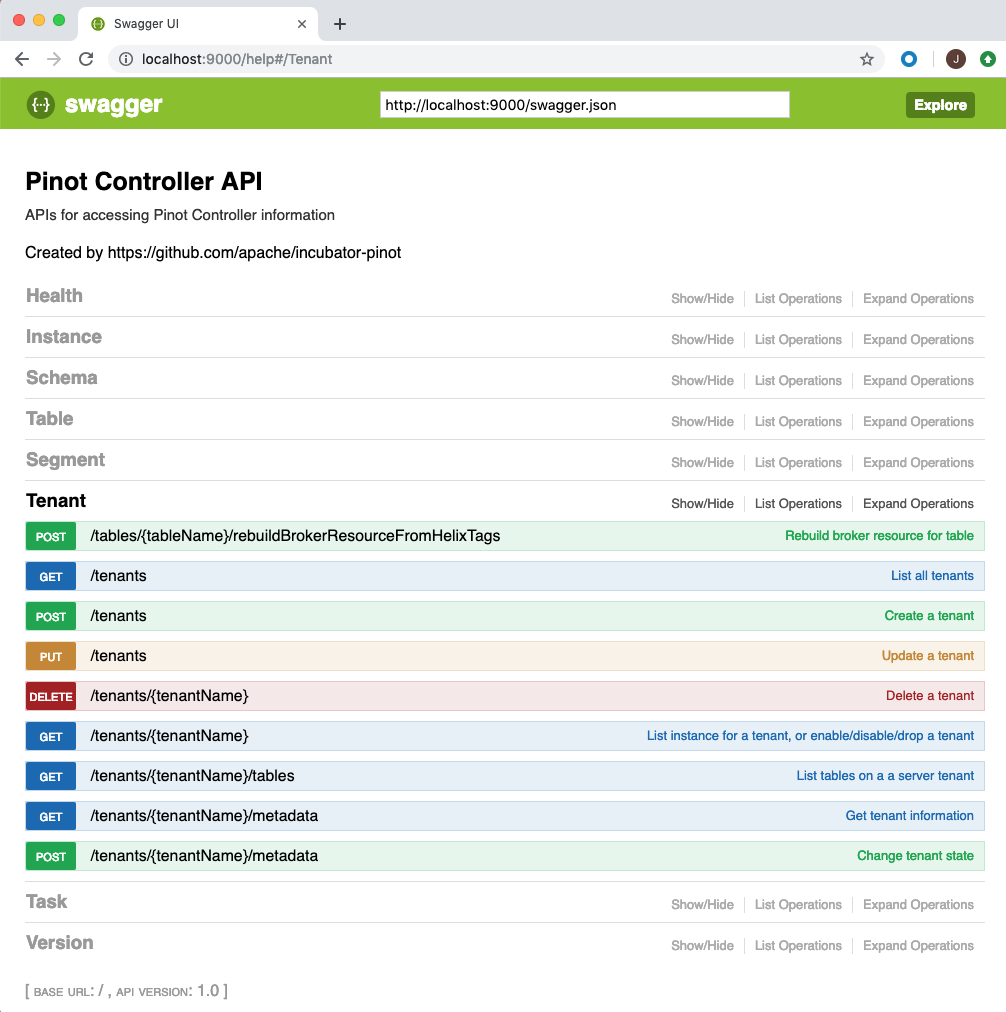
Pinot Management Console
The web based management console allows operations on tables, tenants, segments and schemas. You can access the console via http://controller-host:port/help. The console also allows you to enter queries for interactive debugging. Here are some screen-shots from the console.
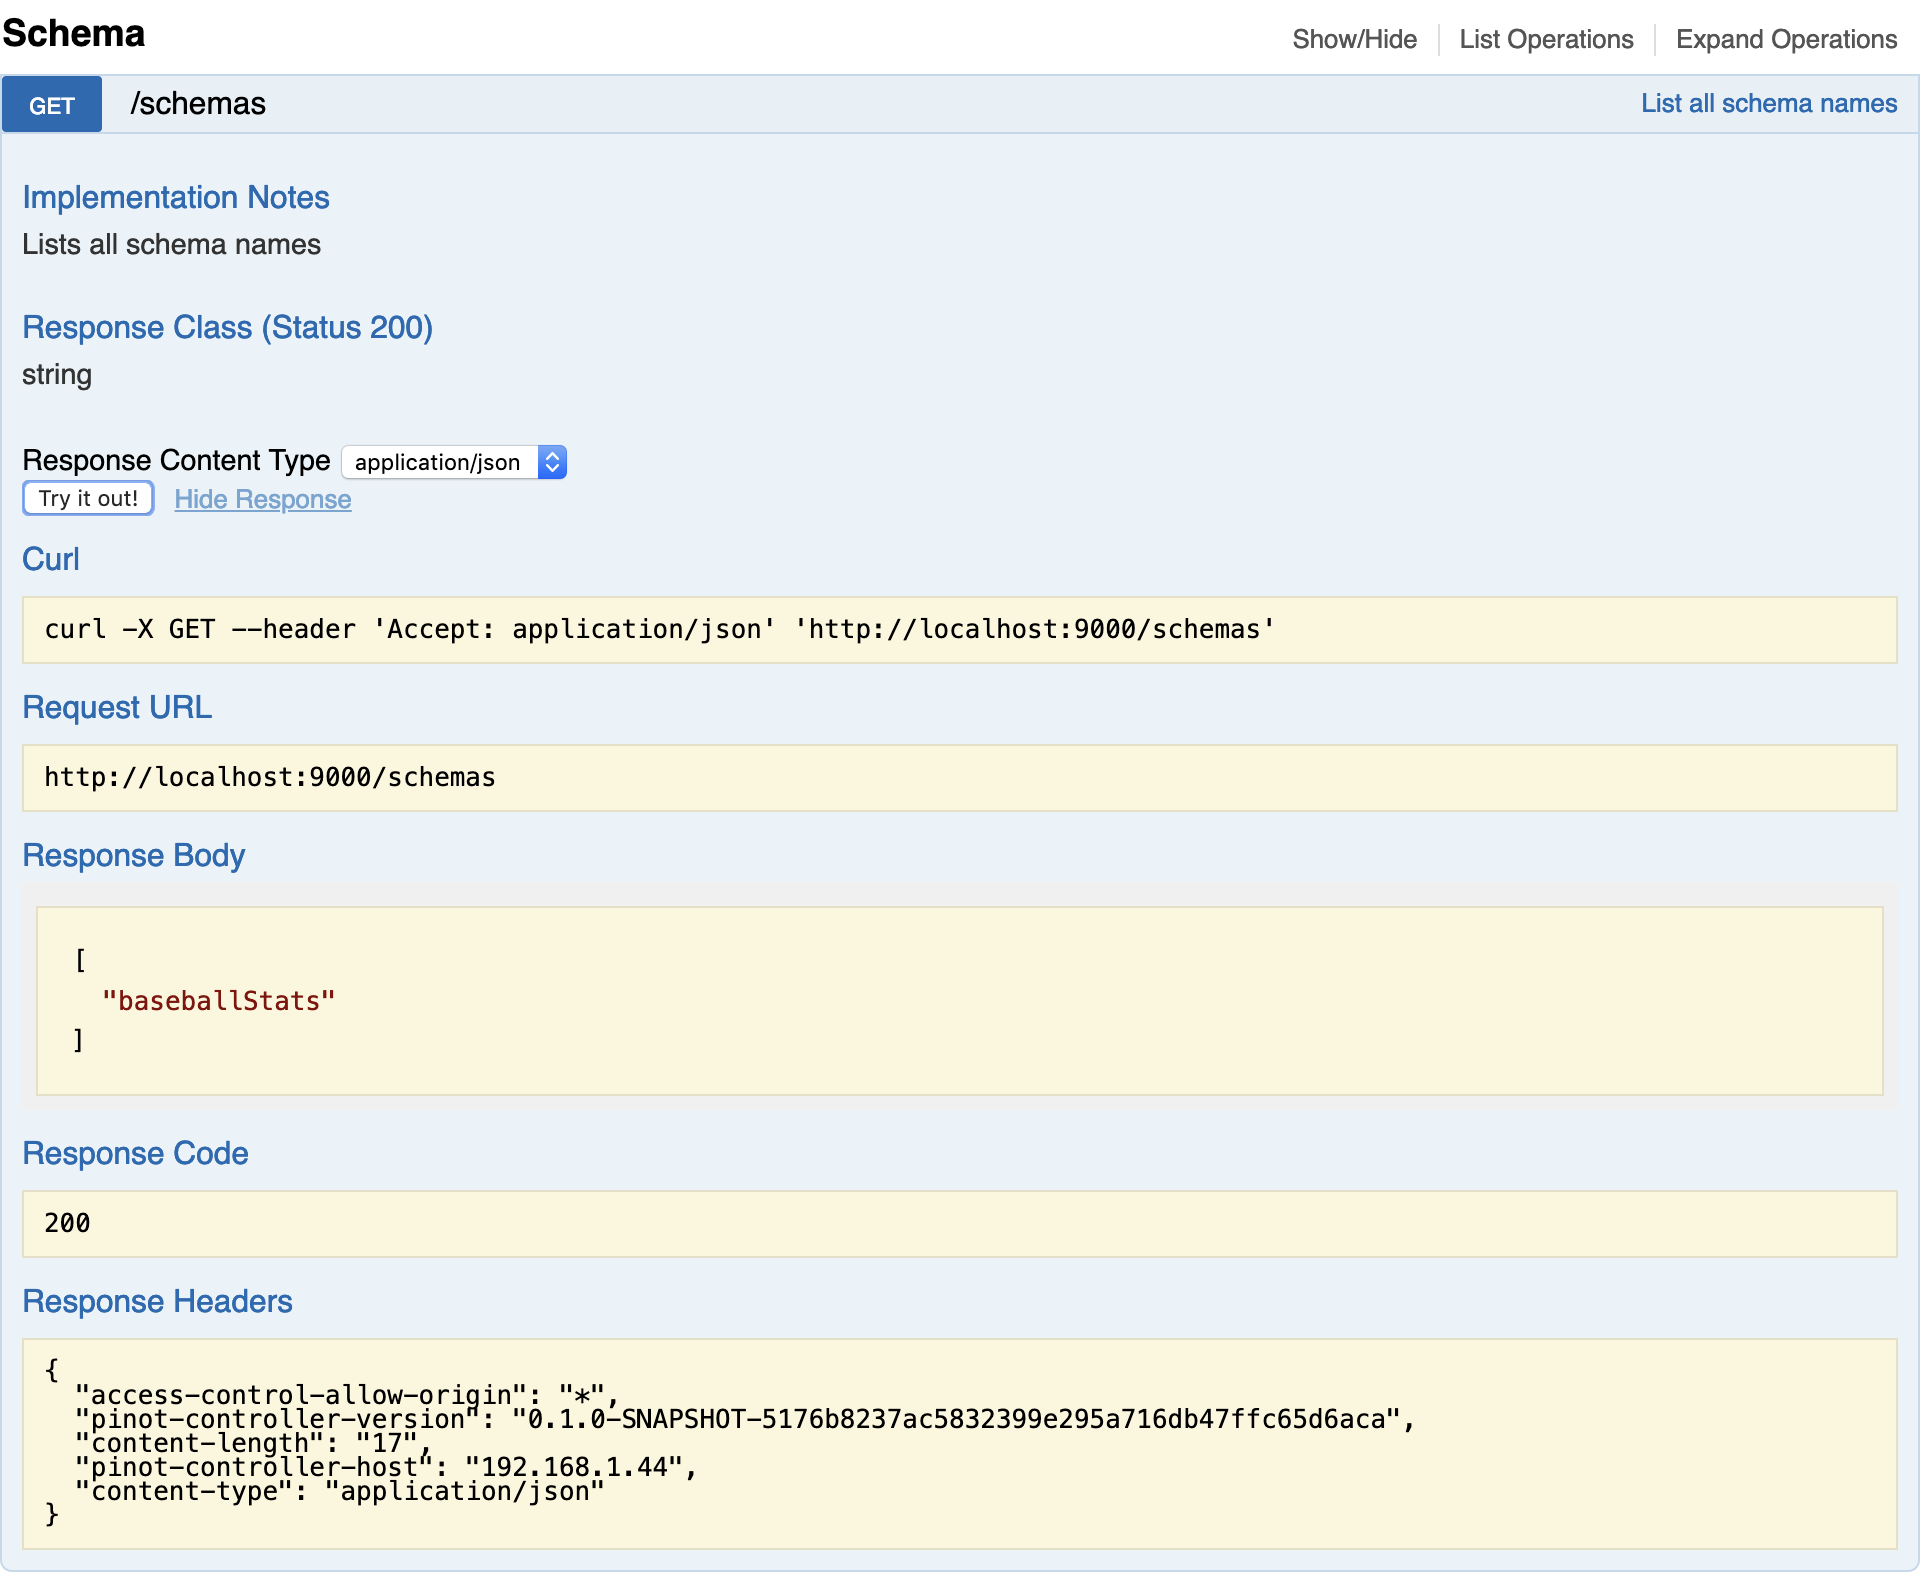
Listing all the schemas in the Pinot cluster:
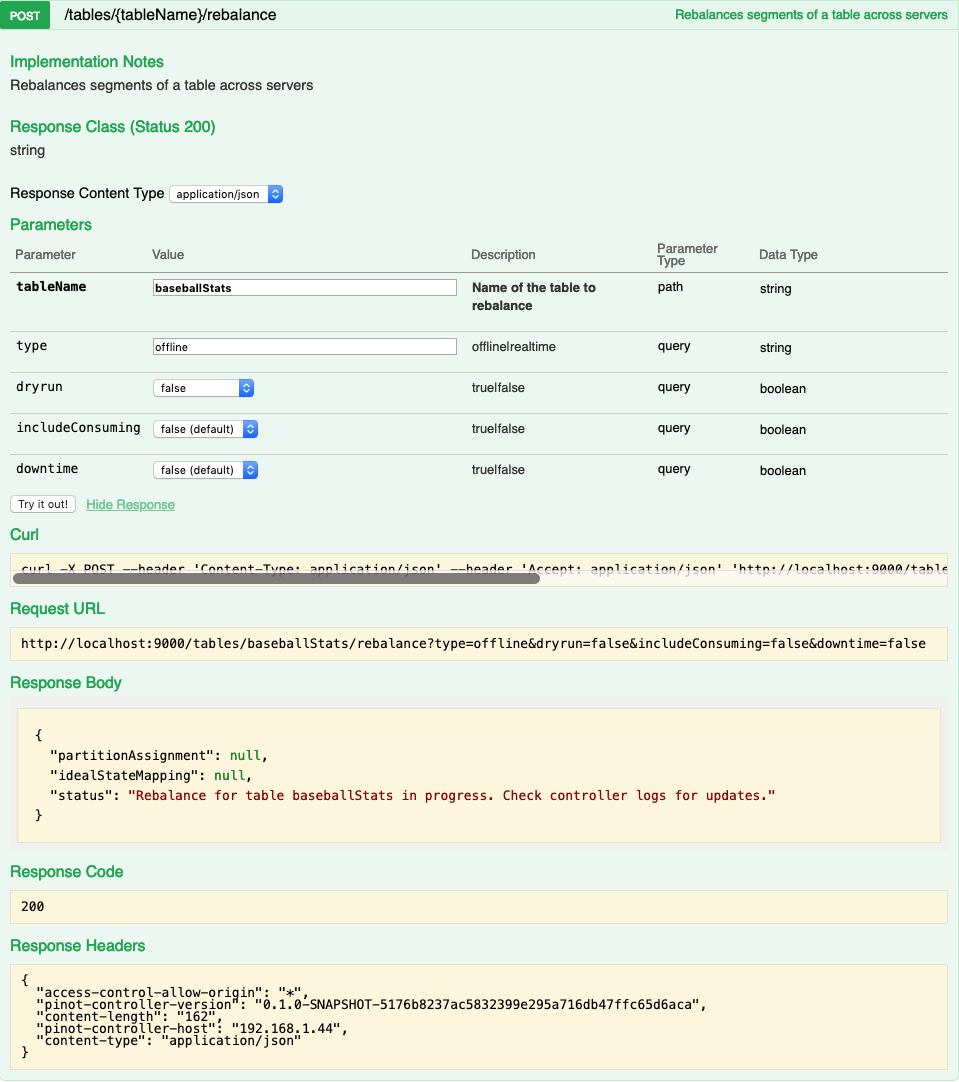
Rebalancing segments of a table:
Command line utility (pinot-admin.sh)
The command line utility (pinot-admin.sh) can be generated by running mvn install package -DskipTests -Pbin-dist in the directory in which you checked out Pinot.
Here is an example of invoking the command to create a pinot segment:
Here is an example of executing a query on a Pinot table:
Monitoring Pinot
Pinot exposes several metrics to monitor the service and ensure that pinot users are not experiencing issues. In this section we discuss some of the key metrics that are useful to monitor. A full list of metrics is available in the section.
Missing Segments -
Number of missing segments that the broker queried for (expected to be on the server) but the server didn’t have. This can be due to retention or stale routing table.
Incoming queries -
Queries received by a broker.
Pinot Controller
Many of the controller metrics include a table name and thus are dynamically generated in the code. The metrics below point to the classes which generate the corresponding metrics.
To get the real metric name, the easiest route is to spin up a controller instance, create a table with the name you want and look through the generated metrics.
Todo
Give a more detailed explanation of how metrics are generated, how to identify real metrics names and where to find them in the code.
Percent Segments Available -
Percentage of complete online replicas in external view as compared to replicas in ideal state.
Segments in Error State -