Monitor Pinot using Prometheus and Grafana
Here we will introduce how to monitor Pinot with Prometheus and Grafana in Kubernetes environment.
Install Pinot helm repo
Configure Pinot Helm to enable Prometheus JMX Exporter
Add to controller.jvmOpts / broker.jvmOpts/ server.jvmOpts . Note that Pinot Docker image already packages jmx_prometheus_javaagent.jar.
Below config will expose pinot metrics to port 8008 for Prometheus to scrape.
You can port forward port 8008 to local and access metrics though:
Configure service annotations:
Add Prometheus related annotations to enable Prometheus to scrape metrics.
controller.service.annotations
broker.service.annotations
server.service.annotations
Deploy Pinot Helm
Deploy Prometheus
Once Pinot is deployed and running, we can start deploy Prometheus.
Similar to Pinot Helm, we will have Prometheus Helm and its config yaml file:
Configure Prometheus
Remember to check the configs:
server.persistentVolume: data storage location/size limit/storage class
server.retention: how long to keep the data (default is 15d)
Deploy Prometheus
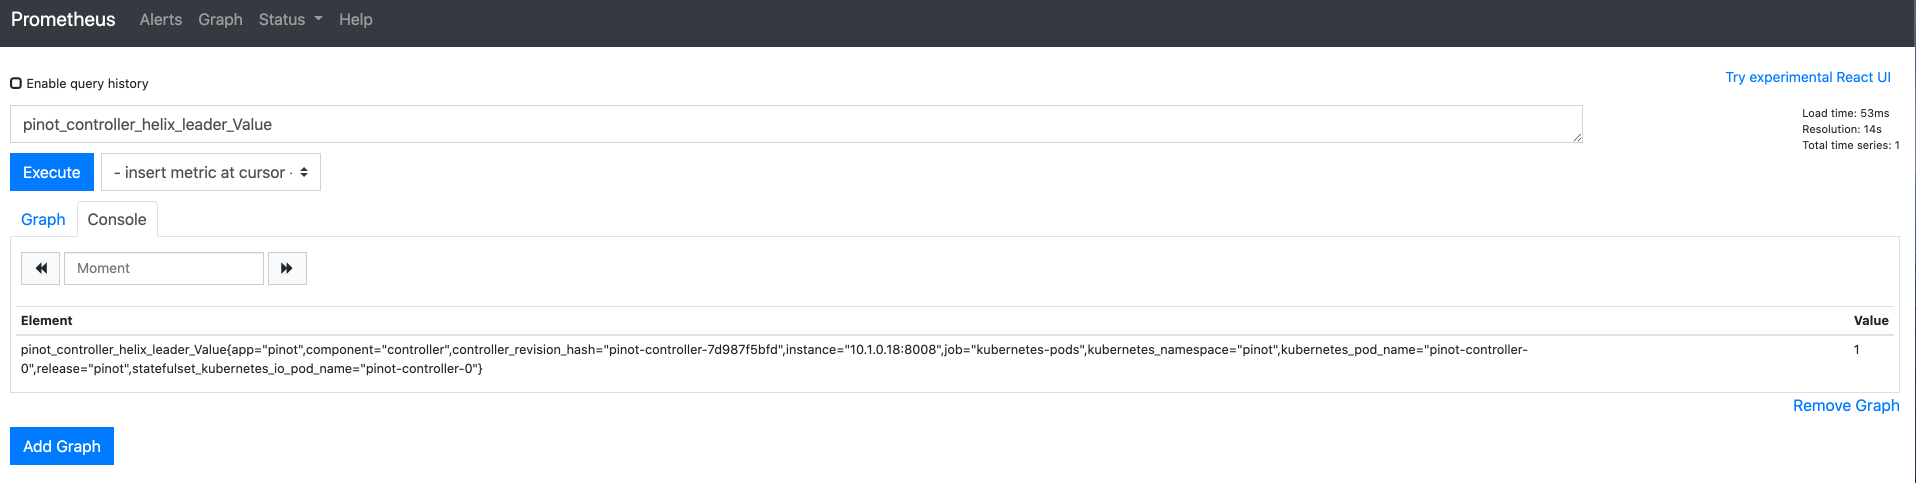
Access Prometheus
Port forward Prometheus service to local and open the page on localhost:30080
Then we can query metrics Prometheus scrapped:
Similar to Pinot Helm, we will have Grafana Helm and it's config yaml file:
Get password to access Grafana
Access Grafana dashboard
You can access it locally through port forwarding:
Log in with your credentials.
admin/[ PASSWORD GET FROM PREVIOUS STEP]
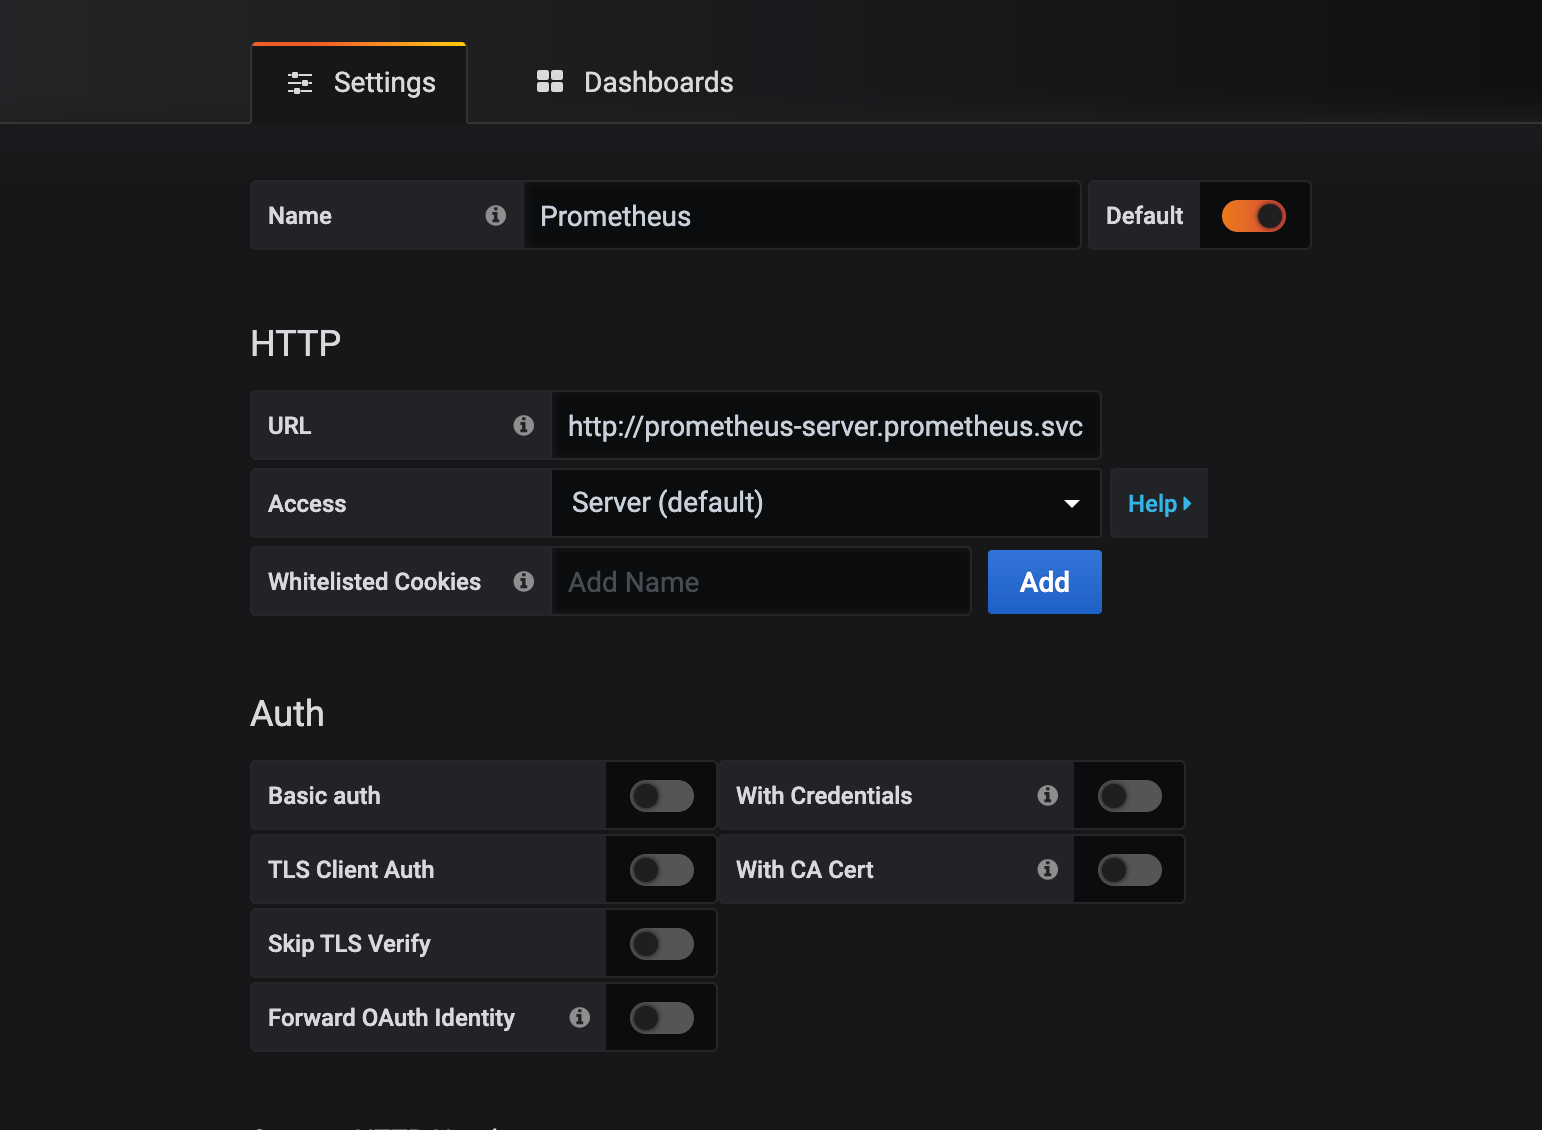
Add data source
Click on Prometheus and set HTTP URL to http://prometheus-server.prometheus.svc.cluster.local
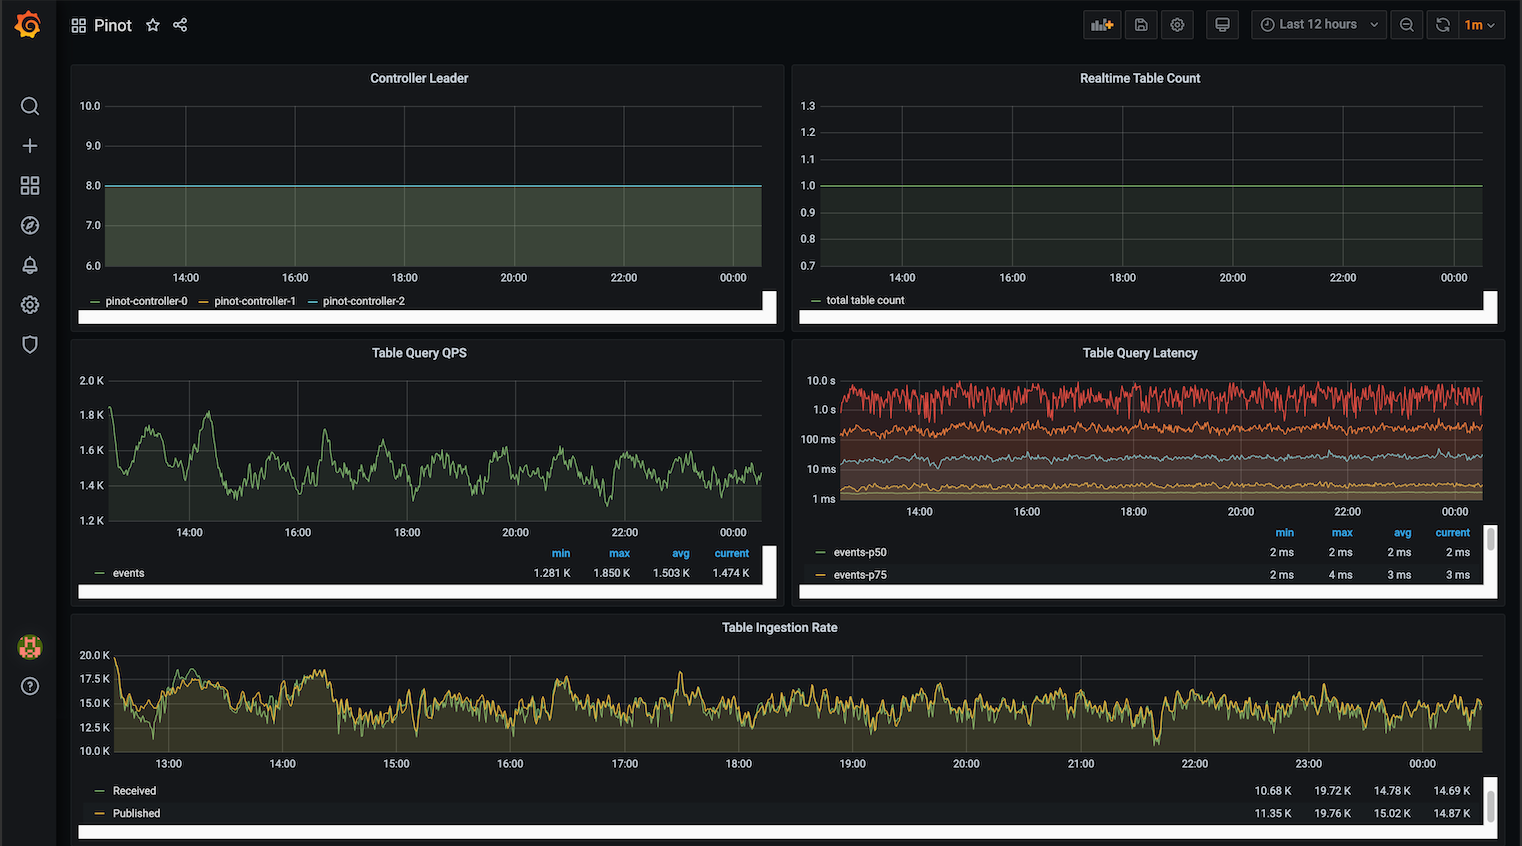
Configure Pinot dashboard
Once data source is added, we can import a Pinot dashboard:
A sample Pinot dashboard JSON is:
Upload this file and select Prometheus as data source to finish the import:
Then you can explore and make your own Pinot dashboard.