arrow-left

All pages
gitbookPowered by GitBook
1 of 2

Loading...

Loading...

Broker Query API

hashtag
REST API on the Broker

Pinot can be queried via a broker endpoint as follows. This example assumes broker is running on localhost:8099

The Pinot REST API can be accessed by invoking POST operation with a JSON body containing the parameter sql to the /query/sql endpoint on a broker.

When TLS/SSL is not enabled:

When TLS/SSL is enabled:

If the SQL statement contains ", in the JSON body, it needs to be replaced by '"'"', for example:

circle-exclamation

Note

This endpoint is deprecated, and will soon be removed. The standard-SQL endpoint is the recommended endpoint.

The PQL endpoint can be accessed by invoking POST operation with a JSON body containing the parameter pql to the /query

hashtag
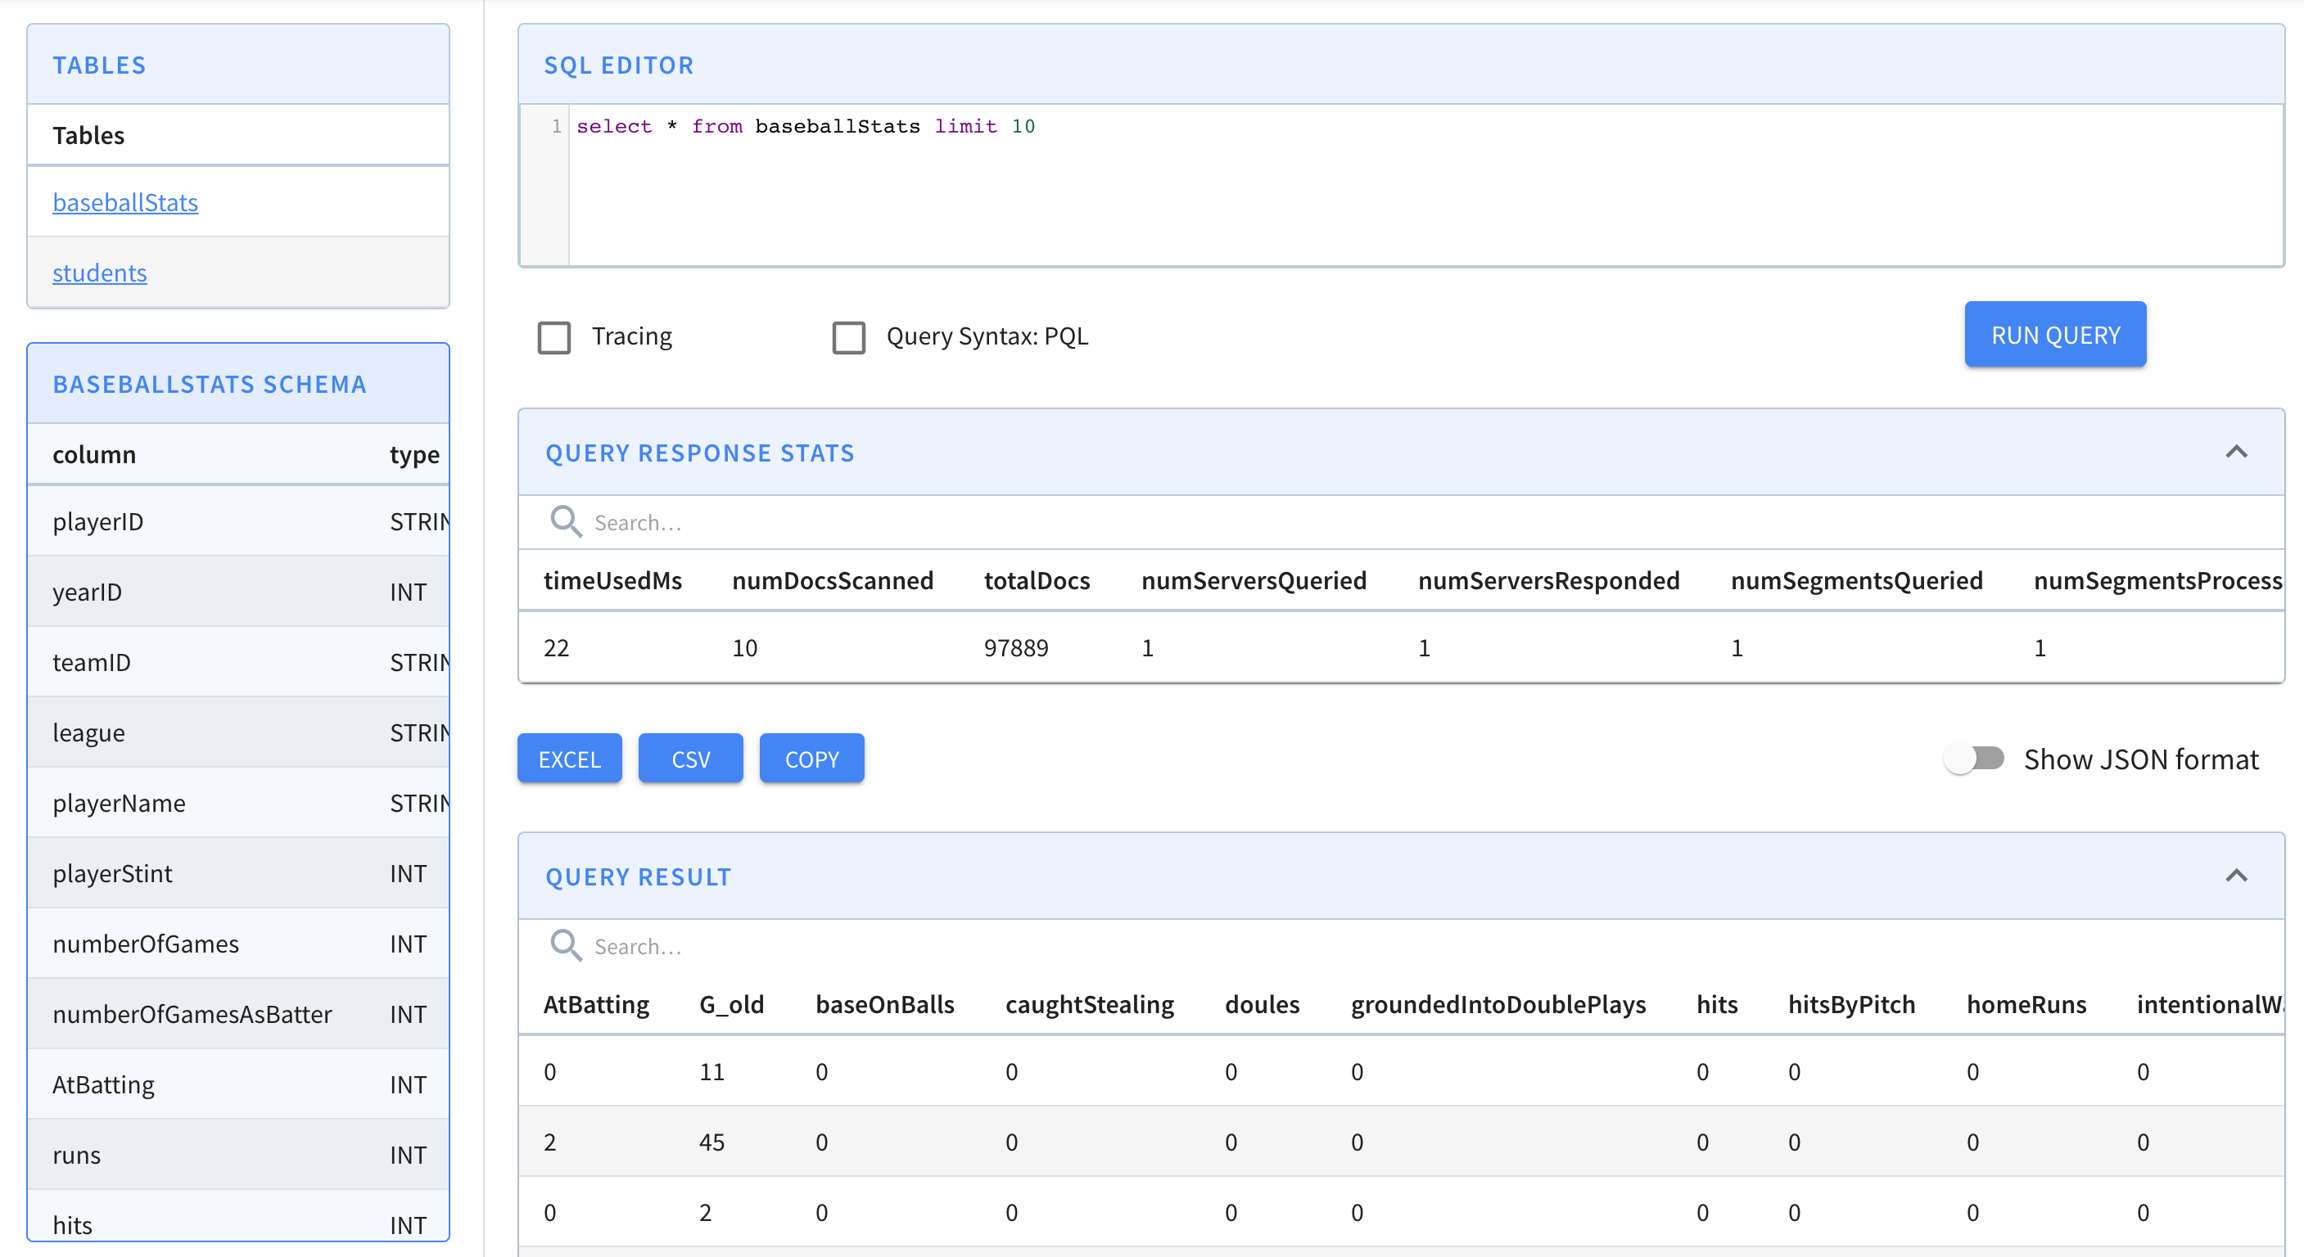
Query Console

Query Console can be used for running ad hoc queries (checkbox available to query the PQL endpoint). The Query Console can be accessed by entering the <controller host>:<controller port> in your browser

hashtag
pinot-admin

You can also query using the pinot-admin scripts. Make sure you follow instructions in to get Pinot locally, and then

hashtag

endpoint on a broker.

When TLS/SSL is not enabled:

When TLS/SSL is enabled:

If the PQL statement contains ", in the JSON body, it needs to be replaced by '"'"', for example:

Getting Pinot
$ curl -H "Content-Type: application/json" -X POST \
   -d '{"sql":"select foo, count(*) from myTable group by foo limit 100"}' \
   http://localhost:8099/query/sql
$ curl -k -H "Content-Type: application/json" -X POST \
   -d '{"sql":"select foo, count(*) from myTable group by foo limit 100"}' \
   https://localhost:8099/query/sql
$ curl -H "Content-Type: application/json" -X POST \
   -d '{"sql":"select foo, count(*) from myTable where foo='"'"'abc'"'"' limit 100"}' \
   http://localhost:8099/query/sql
$ curl -H "Content-Type: application/json" -X POST \
   -
$ curl -k -H "Content-Type: application/json" -X POST \
$ curl -H "Content-Type: application/json" -X POST \
   -
cd incubator-pinot/pinot-tools/target/pinot-tools-pkg 
bin/pinot-admin.sh PostQuery \
  -queryType sql \
  -brokerPort 8000 \
  -query "select count(*) from baseballStats"
2020/03/04 12:46:33.459 INFO [PostQueryCommand] [main] Executing command: PostQuery -brokerHost localhost -brokerPort 8000 -queryType sql -query select count(*) from baseballStats
2020/03/04 12:46:33.854 INFO [PostQueryCommand] [main] Result: {"resultTable":{"dataSchema":{"columnDataTypes":["LONG"],"columnNames":["count(*)"]},"rows":[[97889]]},"exceptions":[],"numServersQueried":1,"numServersResponded":1,"numSegmentsQueried":1,"numSegmentsProcessed":1,"numSegmentsMatched":1,"numConsumingSegmentsQueried":0,"numDocsScanned":97889,"numEntriesScannedInFilter":0,"numEntriesScannedPostFilter":0,"numGroupsLimitReached":false,"totalDocs":97889,"timeUsedMs":185,"segmentStatistics":[],"traceInfo":{},"minConsumingFreshnessTimeMs":0}
d
'
{"pql":"select count(*) from myTable group by foo top 100"}
'
\
http://localhost:8099/query
-d '{"pql":"select count(*) from myTable group by foo top 100"}' \
https://localhost:8099/query
d
'
{"pql":"select count(*) from myTable where foo=
'"
'
"'
abc
'"
'
"'
top 100"}
'
\
http://localhost:8099/query

Query Response Format

hashtag
Standard-SQL response

Response is returned in a SQL-like tabular structure. Note, this is the response returned from the standard-SQL endpoint. For PQL endpoint response, skip to PQL endpoint response

$ curl -H "Content-Type: application/json" -X
Response Field
Description

hashtag
PQL response

circle-exclamation

Note

PQL endpoint is deprecated, and will soon be removed. The standard sql endpoint is the recommended endpoint.

The response received from PQL endpoint is different depending on the type of the query.

$ curl -X POST \
  -d '{"sql":"SELECT SUM(moo), MAX(bar), COUNT(*) FROM myTable"}' \
  localhost:8099/query/sql -H "Content-Type: application/json" 
{
  "exceptions": [], 
  "minConsumingFreshnessTimeMs": 0, 
  "numConsumingSegmentsQueried": 0, 
  "numDocsScanned": 6, 
  "numEntriesScannedInFilter": 0, 
  "numEntriesScannedPostFilter": 12, 
  "numGroupsLimitReached": false, 
  "numSegmentsMatched": 2, 
  "numSegmentsProcessed": 2, 
  "numSegmentsQueried": 2, 
  "numServersQueried": 1, 
  "numServersResponded": 1, 
  "resultTable": {
    "dataSchema": {
      "columnDataTypes": [
        "DOUBLE", 
        "DOUBLE", 
        "LONG"
      ], 
      "columnNames": [
        "sum(moo)", 
        "max(bar)", 
        "count(*)"
      ]
    }, 
    "rows": [
      [
        62335, 
        2019.0, 
        6
      ]
    ]
  }, 
  "segmentStatistics": [], 
  "timeUsedMs": 87, 
  "totalDocs": 6, 
  "traceInfo": {}
}
$ curl -X POST \
  -d '{"sql":"SELECT SUM(moo), MAX(bar) FROM myTable GROUP BY foo ORDER BY foo"}' \
  localhost:8099/query/sql -H "Content-Type: application/json" 
{
  "exceptions": [], 
  "minConsumingFreshnessTimeMs": 0, 
  "numConsumingSegmentsQueried": 0, 
  "numDocsScanned": 6, 
  "numEntriesScannedInFilter": 0, 
  "numEntriesScannedPostFilter": 18, 
  "numGroupsLimitReached": false, 
  "numSegmentsMatched": 2, 
  "numSegmentsProcessed": 2, 
  "numSegmentsQueried": 2, 
  "numServersQueried": 1, 
  "numServersResponded": 1, 
  "resultTable": {
    "dataSchema": {
      "columnDataTypes": [
        "STRING", 
        "DOUBLE", 
        "DOUBLE"
      ], 
      "columnNames": [
        "foo", 
        "sum(moo)", 
        "max(bar)"
      ]
    }, 
    "rows": [
      [
        "abc", 
        560.0, 
        2008.0
      ], 
      [
        "pqr", 
        21760.0, 
        2010.0
      ], 
      [
        "xyz", 
        40015.0, 
        2019.0
      ]
    ]
  }, 
  "segmentStatistics": [], 
  "timeUsedMs": 15, 
  "totalDocs": 6, 
  "traceInfo": {}
}

totalDocs

This is number of documents/records in the table

numServersQueried

represents the number of servers queried by the broker (note that this may be less than the total number of servers since broker can apply some optimizations to minimize the number of servers)

numServersResponded

This should be equal to the numServersQueried. If this is not the same, then one of more servers might have timed out. If numServersQueried != numServersResponded the results can be considered partial and clients can retry the query with exponential back off.

numSegmentsQueried

Total number of segmentsQueried for this query. it may be less than the total number of segments since broker can apply optimizations.

numSegmentsMatched

This is the number of segments processed with at least one document matched query response. In general numSegmentsQueried <= numSegmentsProcessed <= numSegmentsMatched.

numSegmentsProcessed

Number of segment operators used to process segments. This is indicates the effectiveness of the pruning logic.

numDocScanned

The number of docs/records that were selected after filter phase.

numEntriesScannedInFilter

The number of entries scanned in the filtering phase of query execution.

It could be larger than the total scanned doc count because of multiple filtering predicate and/or multi-value entries.

It can also be smaller than the total scanned doc count if indexing is used for filtering.

This along with numEntriesScannedInPostFilter should give an idea on where most of the time is spent during query processing. If this is high, enabling indexing for columns in tableConfig can be one way to bring it down.

numEntriesScannedPostFilter

The number of entries scanned after the filtering phase of query execution, ie. aggregation and/or group-by phases. This is equivalent to numDocScanned * number of projected columns.

This along with numEntriesScannedInFilter should give an idea on where most of the time is spent during query processing.

A high number for this means the selectivity is low (i.e. pinot needs to scan a lot of records to answer the query). If this is high, adding regular inverted/bitmap index will not help. However, consider using star-tree index.

numGroupsLimitReached

If the query has group by clause and top K, pinot drops new entries after the numGroupsLimit is reached. If this boolean is set to true then the query result may not be accurate. Note that the default value for numGroupsLimit is 100k and should be sufficient for most use cases.

exceptions

Will contain the stack trace if there is any exception processing the query.

segmentStatistics

N/A

traceInfo

If trace is enabled (can be enabled for each query), this will contain the timing for each stage and each segment. Advanced feature and intended for dev/debugging purposes

POST
\
-d '{"sql":"SELECT moo, bar, foo FROM myTable ORDER BY foo DESC"}' \
http://localhost:8099/query/sql
{
"exceptions": [],
"minConsumingFreshnessTimeMs": 0,
"numConsumingSegmentsQueried": 0,
"numDocsScanned": 6,
"numEntriesScannedInFilter": 0,
"numEntriesScannedPostFilter": 18,
"numGroupsLimitReached": false,
"numSegmentsMatched": 2,
"numSegmentsProcessed": 2,
"numSegmentsQueried": 2,
"numServersQueried": 1,
"numServersResponded": 1,
"resultTable": {
"dataSchema": {
"columnDataTypes": [
"LONG",
"INT",
"STRING"
],
"columnNames": [
"moo",
"bar",
"foo"
]
},
"rows": [
[
40015,
2019,
"xyz"
],
[
1002,
2001,
"pqr"
],
[
20555,
1988,
"pqr"
],
[
203,
2010,
"pqr"
],
[
500,
2008,
"abc"
],
[
60,
2003,
"abc"
]
]
},
"segmentStatistics": [],
"timeUsedMs": 4,
"totalDocs": 6,
"traceInfo": {}
}

resultTable

This contains everything needed to process the response

resultTable.dataSchema

This describes schema of the response (columnNames and their dataTypes)

resultTable.dataSchema.columnNames

columnNames in the response.

resultTable.dataSchema.columnDataTypes

DataTypes for each column

resultTable.rows

Actual content with values. This is an array of arrays. number of rows depends on the limit value in the query. The number of columns in each row is equal to the length of (resultTable.dataSchema.columnNames)

timeUsedms

Total time taken as seen by the broker before sending the response back to the client

curl -X POST \
  -d '{"pql":"select * from flights limit 3"}' \
  http://localhost:8099/query


{
 "selectionResults":{
    "columns":[
       "Cancelled",
       "Carrier",
       "DaysSinceEpoch",
       "Delayed",
       "Dest",
       "DivAirports",
       "Diverted",
       "Month",
       "Origin",
       "Year"
    ],
    "results":[
       [
          "0",
          "AA",
          "16130",
          "0",
          "SFO",
          [],
          "0",
          "3",
          "LAX",
          "2014"
       ],
       [
          "0",
          "AA",
          "16130",
          "0",
          "LAX",
          [],
          "0",
          "3",
          "SFO",
          "2014"
       ],
       [
          "0",
          "AA",
          "16130",
          "0",
          "SFO",
          [],
          "0",
          "3",
          "LAX",
          "2014"
       ]
    ]
 },
 "traceInfo":{},
 "numDocsScanned":3,
 "aggregationResults":[],
 "timeUsedMs":10,
 "segmentStatistics":[],
 "exceptions":[],
 "totalDocs":102
}
curl -X POST \
  -d '{"pql":"select count(*) from flights"}' \
  http://localhost:8099/query


{
 "traceInfo":{},
 "numDocsScanned":17,
 "aggregationResults":[
    {
       "function":"count_star",
       "value":"17"
    }
 ],
 "timeUsedMs":27,
 "segmentStatistics":[],
 "exceptions":[],
 "totalDocs":17
}
curl -X POST \
  -d '{"pql":"select count(*) from flights group by Carrier"}' \
  http://localhost:8099/query


{
 "traceInfo":{},
 "numDocsScanned":23,
 "aggregationResults":[
    {
       "groupByResult":[
          {
             "value":"10",
             "group":["AA"]
          },
          {
             "value":"9",
             "group":["VX"]
          },
          {
             "value":"4",
             "group":["WN"]
          }
       ],
       "function":"count_star",
       "groupByColumns":["Carrier"]
    }
 ],
 "timeUsedMs":47,
 "segmentStatistics":[],
 "exceptions":[],
 "totalDocs":23
}